
Think about what a 2.5% increase means over four years. Rounding down that is approximately 0.6% per year and when you calculate that annual growth you produce the following values:
In 37 years at the current rate of CO2 increases, we could see a 90 point increase, that is, if we continue to pay lip service to the carbon problem of our modern industrial model.
It should be of deep concern to all humanity that the paradigm of our existence threatens our existence as we know it.
At 499 ppm the 2 Celsius (3.6 Fahrenheit) degree rise that represents the upper limit of the Paris Climate Agreement becomes unachievable. The science used to calculate that upper limit was based on CO2 peaking at 450 ppm. At 499 we’ll be well over that.
Cold comfort comes from the tracking CO2 output from human activity for the last three years. Statisticians tell us CO2 output numbers have been flat, that current human activity hasn’t increased the amount of carbon being pumped into the air. The stated reason, the closing of coal-fired power plants with conversion to the burning of natural gas, combined with an increase in renewable energy.
Of equal concern is the measuring of other industrial greenhouse gasses being produced. What about methane (CH4) levels? What about nitrous oxides (NOx)? Are we measuring their atmospheric concentrations with the same degree of rigour as CO2? In a paper published in the last week in the Proceedings of the National Academy of Sciences, it notes that since 1850 CH4 in the atmosphere has doubled, and after a period of stability from 2000 to 2007 has been rising again. Since CH4 comes from both natural (cow flatulence and melting permafrost) and industrial sources (oil and natural gas fields) one could theorize that a combination of hydraulic fracturing in the United States and permafrost melt increases could explain the rise since 2007. But the paper further comments that the “current surface observation network” for CH4 is inadequate to the task and measuring the gas requires a level of diligence equal to what is being done with CO2.
As for NOx, an equally potent greenhouse gas, the trend indicates that it too is increasing in emission volume in the 21st century. What is the believed cause? Fossil fuel combustion, application of fertilizers containing nitrogen, and the burning of forests in tropical areas. As in the case of CH4, NOx emission tracking lacks the resources deployed to study CO2.
So we have three potent greenhouse gasses contributing to mean atmospheric temperature increases, with a good handle on one, CO2, and far less on the other two. Should we assume that when we begin to bend the CO2 output curve downward we will also see CH4 and NOx declines? Or do we need to be addressing each of the three differently with individual global strategies?
With President Donald Trump in office, and with Scott Pruitt at the head of the Environmental Protection Agency (EPA), we have chief climate policy influencers from the second largest carbon polluter on the planet paying little attention to what I have described above. The President has defined climate change as a “hoax.” And the head of the EPA, a non-scientist has expressed his opinion that CO2 is not a “primary contributor” to global warming. Don’t ask the President or the new EPA head about CH4 and NOx. Neither will register.
This week the United States government has indicated it will announce whether the country will honour the commitments made in the Paris Climate Agreement. The head of EPA has described the agreement as a “bad deal” for the United States.

]]>
This number will abate as the Earth inhales and exhales in its annual cycle. With summer about to arrive in the northern hemisphere new plant growth will perform as a carbon sink sucking CO2 from the air. But don’t expect to see the cyclical drop to go below 400 ppm as has happened in recent years.

The recorded accumulated rise since March 1958 when the first measured at Mauna Loa has now increased by nearly 100 ppm. And 12 other sites around the globe verify that the levels observed in Hawaii can be found everywhere.
In the past month newspapers have reported that our shift to renewables and the decline in coal use has stalled anthropogenic CO2 emissions these last two years. In its latest report the International Energy Agency states that its sector released 32.1 billion tons of CO2. Other human industrial activity make up the balance of the estimated 40 billion metric tons of CO2 released.

So why did Mauna Loa record a spike? There are several reasons:
Climatologists have noted that El Ninos cause CO2 levels in the atmosphere to rise. One of the reasons is the warmer ocean surface water associated with El Nino events releases CO2 into the atmosphere. The location of the warming surface waters also plays a role by altering tropical rainfall patterns leading to droughts and die offs which turns normal carbon sinks into emitters.
And here is a more significant issue. Although we have seen a 5 ppm rise this year it has happened during the El Nino. If we look at past El Nino CO2 boosts the gas post-El Nino rises even higher. That may mean we will see in 2016 and 17 even more significant spikes in CO2.
At 400 ppm we have witnessed a rise in global mean temperatures of 1 Celsius (1.8 Fahrenheit). With every uptick in the CO2 counter climatologists expect annual mean temperatures to rise even further. And when you consider that this March was globally the hottest in recorded history it’s disconcerting to look at the snail’s pace level of progress our political leadership is making in addressing policy to begin to mitigate the growing crisis. How much longer can we be the frog in pot of water sitting on top of a stove burner?

In a New York Times article written by Justin Gillis on May 10, he quotes Dr. Maureen E. Raymo, a geologist at Columbia University. “It feels like the inevitable march toward disaster,” she states. Dr. Raymo points out that the last time the 400 mark was surpassed, based on the geologic record, was the end of the Pliocene, a period before the beginning of the Ice Age. In the Pliocene Africa’s Savannah was fully covered in forests. Ellesmere Island in the Canadian Arctic supported beavers, larch trees, horses and giant camels. Our planet was as much as 4 Celsius (7.2 Fahrenheit) degrees warmer than where we were in the mid-19th century at the dawn of the Industrial Age. And sea levels were higher, estimated to have elevated been 10 and 20 meters (33 to 66 feet). Dr. Raymo points out that even at the low end one quarter of the U.S. population would be impacted by such sea level changes.
Other reactions around the world have been variations on the same theme. Sir Brian Hoskins who heads up the Climate Change Committee at the Royal Society in the UK states: “Before we started influencing the amount of carbon dioxide in the atmosphere, over the last million years it went between about 180 and 280 parts per million…. Now, since the Industrial Revolution and more in the last 50 years, we’ve taken that level up by more than 40% to a level of 400 and that hasn’t been seen on this planet for probably four million years” Hoskins in his comments puts a positive spin to things stating, “around the world, there are things happening, it’s not all doom and gloom.” He is referring to what China is doing in its latest five year plan which sets a goal of reversing the environmental damage done by unprecedented growth over the last thirty years. For China this involves a heavy push to renewable energy and away from coal and fossil fuels.
Dr. Raymo as a geologist takes her perspective from the geological record of past ice ages separated by interglacial warming periods. She points out that it doesn’t take a lot of increased CO2 to get warming going. For example in the last interglacial period it took a few thousand years for the ice sheets on Greenland and West Antarctica to melt. The interglacial period lasted 30,000 years, three times longer than the one we are experiencing today. And at no time did CO2 levels approach 400 parts per million in those 30,000 years. She further states that even if we stopped the rise in CO2 levels today, that the atmosphere would continue to warm for centuries. “For me personally that’s the scary thing….we really don’t know what we’ve already committed ourselves to,” she concludes.
There may be some consolation for the climate change deniers. The 400.08 reading at Mauna Loa is the Earth breathing out in the annual cycle that is clearly visible on the Keeling Curve graphs (the plot below is of observations for the last week). That reading should drop below 400 later in the year according to James Butler of NOAA who is quoted in an interview with the BBC as stating: “Carbon dioxide has some variability on an hourly, daily and weekly basis, so we are not comfortable calling a single number — the lowest we will go is on a daily average, which has happened in this case…this is the first time the daily average has passed 400 parts per million at Mauna Loa. Probably next year, or the year after that, the average yearly reading will pass 400. In eight or nine years we will probably have seen the last CO2 reading under 400 parts per million.”

But climate change deniers, don’t feel too complacent. I leave you with the last word from Dr. Hoskins whose previous optimism in reference to China is countered by another recent statement,Given current human activity, levels of CO2 could be near 800 parts per million by the end of the Century.
]]>
The graph that appears below is known as the Keeling Curve, names after Charles Keeling, the scientist who began documenting fluctuations in atmospheric CO2 back in 1958. Mauna Loa is a good site to do atmospheric data collection because it is far from any major continental land mass. When Keeling started measuring back in 1958 CO2 levels were 317 parts per million. If you subscribe to the Twitter feed you can witness when CO2 passes 400.
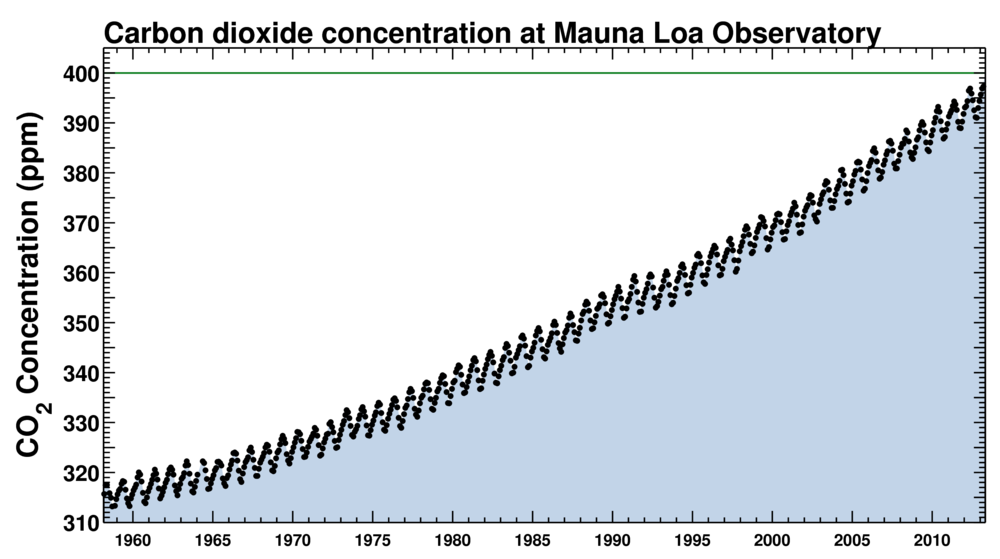
We have only measured CO2 at Mauna Loa since 1958 but we can sample old air trapped as bubbles in ice cores from the Antarctic and Greenland. These bubbles date back to the Ice Age when CO2 concentrations varied from 200 to 300 parts per million. We also can measure historic CO2 levels using geochemistry allowing us to go back even further, millions of years in fact, to a time before humans existed. At that time between 3 and 5 million years ago, the Mid-Pliocene, mean global temperatures were 2 to 3 Celsius (3.6 5.4 Fahrenheit) degrees higher than today. The polar areas of the Mid-Pliocene were much warmer with temperatures 10 Celsius (18 Fahrenheit) degrees higher on average. With warmer poles, polar ice cap melting caused sea levels to rise between 5 and 40 meters (16 to 131 feet). As evidenced from the fossil record, tropical flora and fauna both on land and sea migrated toward the poles. Even Ellesmere Island, high in the Canadian Arctic, had forests where today there is just ice, moss, lichens, scrub grass and bare rock.
So in the next few months with the average annual rise of atmospheric CO2 at 1.9 parts per million we should see 400 breached and you can be alerted on Twitter the moment it happens. Something to tell your children and grandchildren about.
Al Gore writes in The Future, a book I recently reviewed, “Roughly a quarter of the 90 million tons of global warming pollution we put into the atmosphere each day will still linger there — still trapping heat — more than 10,000 years from now.”
It is a sad statement about our human nature that we choose not to solve this CO2 challenge by an all out effort to move away from fossil fuel-based energy generation. The problem and evidence is staring us in the face and yet only 2% of our present energy consumption comes from renewables today. The rest involves burning carbon. This carbon legacy will continue to be measured by the Keeling Curve in coming decades as we surpass 400 this year and watch the number climb to 450 by 2040 even if we mitigate our carbon burning ways starting now. And we must.
]]>