
Note the dip that precedes the period of the Maunder Minimum. The two together have been described by some historians and climatologists as the Little Ice Age. Evidence of colder winters appears in period paintings like that done by Pieter Brueghel and reproduced below. Rivers, harbors and canals in parts of the world today where no such winter freeze occurs became covered in ice.

According to scientists the Maunder Minimum reduced average global temperatures by 0.3 to 0.4 Celsius (0.54 to 0.72 Fahrenheit) degrees. A similar but shorter-lived solar minimum observed in the second decade of the 19th century may have contributed to the demise and defeat of Napoleon’s Grande Armée as it froze in the Russian winter.
Now climate scientists are once again observing a precipitous drop in solar activity well below the normal eleven year sunspot cycle. This has been ongoing since 2006. The lowest sunspot occurrence in the recent cycle was noted in September of 2009 with only 8 visible on the solar disk. In comparison during parts of 2013, 70 sunspots were visible.

For climate change deniers the recurrence of an event like the Maunder Minimum reinforces their argument that global warming is really not happening, that it is a myth perpetrated on the public by a global conspiracy of world scientists. But they are wrong. There is no doubt that low Sun activity may diminish the impact of rising carbon dioxide in the atmosphere, but it is not, stopping global mean temperatures from rising.
If you doubt that last fact, note the following information provided by the National Oceanic and Atmospheric Administration : 2013 was the fourth warmest year recorded since 1880; 2010 was the warmest since records have been kept; and 9 of the 10 warmest years on record have all happened in the 21st century; and finally, only one year in the 20th century was among the 10 warmest on record and that was 1998. So despite changes in the Sun’s behavior and low sunspot activity indicating a potential new Maunder Minimum, we are not descending into another Little Ice Age.
There is, however, another story associated with low Sun activity. With a decline in solar radiation comes a decline in the solar wind. That has consequences for human exploration of Deep Space including those plans to go to Mars.
Nathan Schwadron, Associate Professor, Space Plasma Physics, at University of New Hampshire, argues that low Sun activity could be the death sentence for planned human expeditions beyond near-Earth. With diminished solar wind, cosmic rays originating from outside the Solar System will increasingly bombard the regions of the inner planets. And that means the space near us will become more radioactive than today. For astronauts traveling to the International Space Station, they will enjoy the protection of Earth’s magnetic field. But spacefarers going to the Moon and beyond don’t have that same protection.
Schwadron and his colleagues in studying data from the Lunar Reconnaissance Orbiter circling the Moon are getting readings from the on board Cosmic Ray Telescope, known as CRaTER, that indicate a rising risk to those traveling through interplanetary space.
The problem of cosmic radiation is not new to NASA. The agency developed a measure for Risk of Exposure Induced Death (REID) and when Curiosity traveled to Mars, and while it has been on the surface of the planet, it provided radiation readings. They show that the 180-day journey outbound, a 500-day stay on the planet’s surface, and a 180-day return would increase REID by 5%. That’s a 5% greater risk of an astronaut succumbing to cancer from radiation. Cosmic radiation reads from CRaTER, however, appear to contradict the Curiosity data indicating a greater risk involved in light of the recent decrease in solar activity.
Schwadron and his team, have published their study in the journal, Space Weather. Their conclusions: the maximum time any human spacefarer will be reasonably safe is under one Earth year.
For Mars One and for NASA and other nations or commercial operators planning to go to Mars, unless they develop better shielding technology, or faster propulsion systems to shorten the time in interplanetary space, these new observations could be a showstopper.
So the repeat of a Maunder Minimum associated with the 17th and early 18th century Little Ice Age, caused by low Sun activity, may to some degree mitigate the impact of rising carbon dioxide leading to a slow down in the warming on our planet. That could give us a bit of breathing room in our transition to a low carbon economy. But for those dreaming of humans on Mars and the Moon, it may prove to be a real bummer.
An excellent infographic appearing on the Space.com website details the risks associated with exposure to cosmic radiation. It is reproduced below.

So let’s look at what we know about the surface melt over Greenland this summer. Satellite images from two dates, the first July 8, and the second July 12, 2012, show a change in the thawing of the ice at or near the surface of the island’s massive ice sheet. I’ve reproduced the images below. The one on the left shows about 40% of the ice mass undergoing surface melting. The one on the right shows 97% of the ice mass experiencing surface melting. The darker pink indicates absolute certainty that melting is occurring corroborated by two or three satellites. The lighter pink areas are probable melting zones corroborated by one satellite. This is a dramatic jump from previous years.
At Greenland’s highest point, 3.2 kilometers (2 miles) above sea level melting was observed. Melting of this kind at this location has not occurred since 1889. We know this because we have sampled ice cores from this area. And something else those ice cores show us – melting of this type seems to occur every 150 years give or take a margin of error. So from 1889 to 2012 we have 123 years. Is that within the margin of error seen from historic records? Only time will tell.
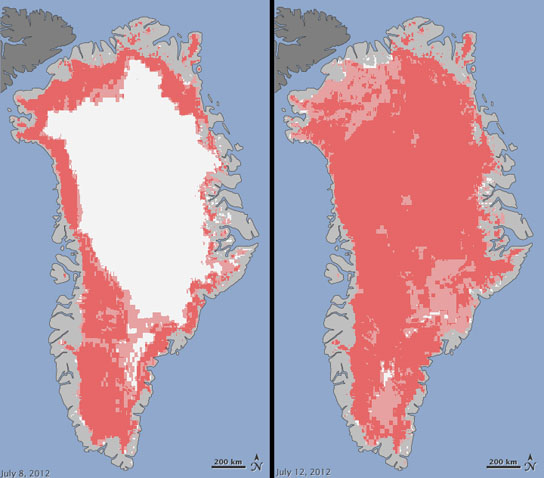
Satellites have been observing Greenland for 30 years. Melting occurs every summer with the average melt impacting 50% of Greenland’s surface ice. Most of this water inland refreezes in place. Some tunnels down through the ice forming underground rivers that increase the ice viscosity on down slopes. And near the ocean edge, melting at the surface runs off or in tunneling increases the flow of ice and formation of ice bergs.
The satellites that recorded the data to create these maps included NASA’s Terra and Aqua satellites and the U.S. Air Force’s meteorological satellite, Oceansat-2. Unusual weather is blamed for what is truly an unprecedented amount of surface melting. Greenland has experienced a strong series of warm high pressure ridges since the end of May with each warmer than the last. The current ridge began dissipating on July 16. Prior to that daytime temperatures in central Greenland hovered around zero Celsius (32 Fahrenheit).

We need to separate this recent observation from the climate change debate. Ice core data from Greenland is the best way to do this. Take a look at the above chart. It shows the periodicity of warming and cooling of Greenland’s ice sheet. We cannot blame past oscillations on our Industrial Age and rising CO2. The historic data, therefore, arguably demonstrates that what we are observing today may be caused in part by other variables. So having given the global warming deniers their due I leave the last word for the scientists who reported their findings. One of them, Lora Koenig, of the Goddard Space Flight Center, stated, ” Ice cores…show that melting events of this type occur about once every 150 years on average. With the last one happening in 1889, this event is right on time….but if we continue to observe melting events like this in upcoming years, it will be worrisome.”
]]>

