
When asked by reporters about the results being linked to human activity, the researchers at the Scripps Institute answered:
“The rise in CO2 is unambiguously caused by human activity, principally fossil-fuel burning. This is clear from the numbers: We know how much fossil fuel is converted into CO2 each year and emitted into the atmosphere. The CO2 doesn’t all stay there because some enters the ocean and some is taken up by photosynthesis, which ends up in land plants and various types of biomatter.
“Carbon atoms are not created or destroyed in any of these processes, so the total fossil-fuel emission to date must equal the combined increases in these other reservoirs. We can document large carbon increases in all these reservoirs. In the atmosphere, it’s especially easy, because the atmosphere is quite well mixed. As it happens, about 57 percent of the emissions have remained in the air.
“It’s true that atmospheric CO2 has almost certainly been higher than present in Earth’s distant past, many millions of years ago. But because fossil-fuel burning is not natural, the recent carbon increases in the atmosphere, oceans, and land biosphere cannot be natural either. And you are correct that even though the levels of CO2 in the air may not be unprecedented, the pace of rise probably is. Few if any natural processes can release fossil carbon into the atmosphere as fast as we humans are doing it now via the extraction and burning of fossil fuels.”
And if we reconstruct atmospheric CO2 levels going back 800,000 years (we can do this by sampling gases in ice cores taken from alpine and continental glaciers) then we see that at no point in recent history has CO2 increased so dramatically as it has since 1950.

Through interglacial periods, CO2 levels have fluctuated from below 200 ppm to nearly 300. These variances have happened over thousands and tens of thousands of years.
Now look to the right end of the graph and see how the tracing suddenly goes almost vertical. That’s representative of our modern industrial society and correlates with the burning of carbon-based fuels since the Industrial Revolution in the 19th century and its spread from Europe and North America to the rest of the planet. The curve also matches the growth in Earth’s human population.
No occurrence in nature can account for this sudden rise. There have been no sudden methane or CO2 burps from the ocean depths or any massive greenhouse gas releases from melting permafrost. There has been no bombardment of the Earth by a celestial source bringing these gases to the atmosphere during this period of recorded history. All there is just us humans burning coal, oil, gasoline, diesel, and natural gas, and at the same time increasing our population by more than 700% in just over a century.
]]>

May 10, 2018 – While in Aruba last week I met a couple from Kentucky who described the bitter cold and snow they experienced this winter. When I mentioned climate change they looked at me like I was crazy because to them the only climate change is global warming and if it isn’t warm out then the whole idea is bunk. This is not an uncommon state of mind for many who find themselves confused by the two very different terms. Whereas global warming makes us think of a very specific type of climate change, the latter more generic term better describes what is happening here on our planet.
Climate change has always happened throughout our planet’s history. Before our modern civilizations came into existence the planet experienced several million years of episodic ice ages. Prior to that, the climate of most of the planet was warmer than anything we experience today. And going back further Earth has gone from a frozen ball of ice to a tropical sweatbox. The carbon we burn today came from one of those sweatbox periods in the planets’ geological past.
To clarify terminology, when speaking to people on this subject I call what we are experiencing anthropogenic climate change, that is, climate change influenced by human activity. It may sound more high fallutin than plain climate change, but adding anthropogenic points to the problem of the current planetary experience, and it is unprecedented in terms of the speed in which the change is occurring.
In the past few weeks, a number of reports have come out that should be troubling to all of us.
CO2 Continues to Rise
The first was results of tracked carbon dioxide (CO2) in the atmosphere as observed from the top of the Mauna Loa Observatory in Hawaii. Those readings exceeded 410 parts per million over an entire month for the first time since CO2 records started being kept. To put it in perspective, atmospheric CO2 since 1880, when humans started burning a lot more fossil fuels to serve industrial growth, has increased from 280 to plus 410. That’s a 130 parts per million increase in a little more than 130 years. Project that out to the end of the century and CO2 could be as high as 490 parts per million with no human ever having lived through a time in Earth’s past when CO2 levels were that high. And that’s putting a positive spin on CO2 levels. Because in actual fact the rate of CO2 atmospheric growth is accelerating. Steady-state projects of 1 part per million a year underestimate the current reality of increases of 2.5 parts per million annually. That conceivably means we’ll see CO2 levels more than double from the first records kept back in 1880 by 2100. These are indeed uncharted waters. In the Mauna Loa observatory’s announcement, Katharine Hayhoe, climate scientist at Texas Tech University states, “As a scientist, what concerns me the most is not that we have passed yet another round-number threshold but what this continued rise actually means: that we are continuing full speed ahead with an unprecedented experiment with our planet, the only home we have.”
Disease Vectors on the Move
The United States Centers for Disease Control and Prevention (CDC) also gave us troubling news describing changes to disease vectors not normally seen in the Continental United States. New tickborne diseases were reported to be on the rise. In Puerto Rico, mosquito-borne Dengue and Zika were more prevalent. The latest Vital Signs CDC report noted that mosquito, tick and flea-borne diseases had tripled in the United States from 2004 to 2016. That nine new mosquito and tick-spread germs (Zika among them) had been discovered since 2004, and that 80% of disease control organizations within U.S. counties and states lacked the critical skills and capacity to deal with these spreading outbreaks. Why was this happening? As has become the case in almost all U.S. public service sites, there is little mention of anthropogenic climate change. These are words that are being scrubbed clean from the government under the new administration. But there is no doubt that disease vector changes and anthropogenic climate change are inextricably linked.
Nature Ill Adapted to “New Norms”
And to make matters worse, the alteration in weather patterns with exaggerated polar vortices, a Jet Stream that no longer conforms to what we have seen in the past, and even a weakening of coastal ocean currents with their attendant climate impacts, the new norms being experienced are screwing mother nature. Birds are arriving from winter habitats to conditions where feeding is difficult. Where unnatural warming is occurring the timing of insect emergence and bird breeding is completely getting screwed up. If birds are born before insects emerge, there is no food for them. If birds are born after insects have emerged and pupated to become adults, food supply may be insufficient as well. Mounting evidence in recent UK studies shows this to be the case. The animals that rely on seasonal change to mate and rear young are getting screwed.
Mad-hatter Geoengineers at the Tea Party
And then there are the reports of geoengineering experiments, from China’s Sky River artificial rain experiment to a number of U.S. experiments involving sunlight reduction including:
Even the Antarctic and Greenland are not being spared from geoengineering tamperers who want to wall off the continental and island-based ice sheets from the eroding effects of warming ocean waters. In one case engineers propose building walls of artificial islands to separate land ice from the ocean. In another idea it is proposed that glaciers be shored up by removing water from under the glacier to slow their descent towards the sea, and using the water collected to construct ice berms at the ice face. One proposal calls for artificial islands to jam ice shelves so the land-based glaciers behind cannot move the ocean edge and calve bergs. These ideas appear in a March issue of Nature.

Meanwhile, with all these geoengineering pie-in-the-sky proposals, a science advisor to the U.S. Senate warns that “there is zero governance” around humans tampering to reverse engineer anthropogenic climate change’s worst effects. Whether engineers are attempting to hold back the ice, or manipulate atmospheric processes, or deflect sunlight, there is no one in charge globally or locally. Yet if one or more of these projects is enacted, the consequences of a butterfly effect have not been considered. Change atmospheric processes in one area and who knows what negative consequences will occur somewhere else.
]]>This number will abate as the Earth inhales and exhales in its annual cycle. With summer about to arrive in the northern hemisphere new plant growth will perform as a carbon sink sucking CO2 from the air. But don’t expect to see the cyclical drop to go below 400 ppm as has happened in recent years.

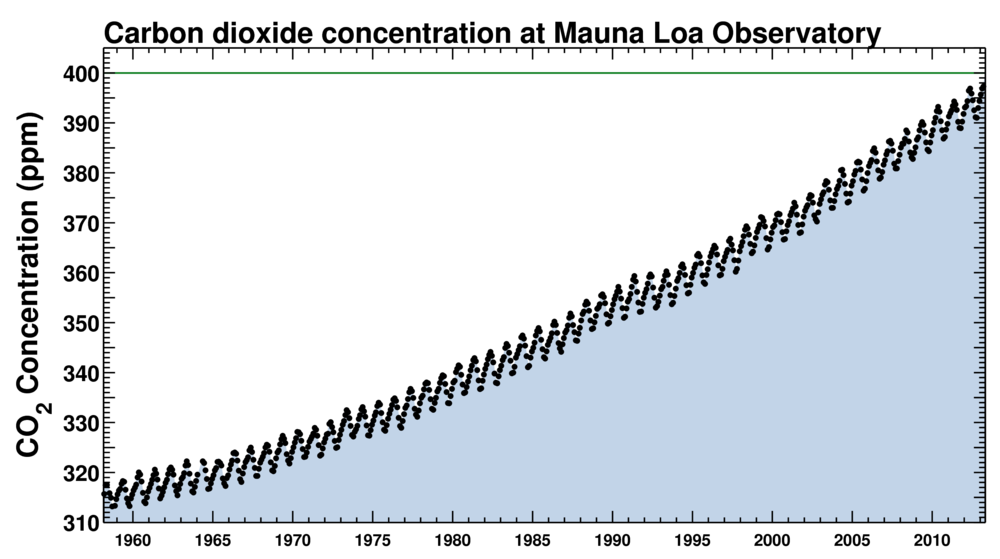
The recorded accumulated rise since March 1958 when the first measured at Mauna Loa has now increased by nearly 100 ppm. And 12 other sites around the globe verify that the levels observed in Hawaii can be found everywhere.
In the past month newspapers have reported that our shift to renewables and the decline in coal use has stalled anthropogenic CO2 emissions these last two years. In its latest report the International Energy Agency states that its sector released 32.1 billion tons of CO2. Other human industrial activity make up the balance of the estimated 40 billion metric tons of CO2 released.

So why did Mauna Loa record a spike? There are several reasons:
Climatologists have noted that El Ninos cause CO2 levels in the atmosphere to rise. One of the reasons is the warmer ocean surface water associated with El Nino events releases CO2 into the atmosphere. The location of the warming surface waters also plays a role by altering tropical rainfall patterns leading to droughts and die offs which turns normal carbon sinks into emitters.
And here is a more significant issue. Although we have seen a 5 ppm rise this year it has happened during the El Nino. If we look at past El Nino CO2 boosts the gas post-El Nino rises even higher. That may mean we will see in 2016 and 17 even more significant spikes in CO2.
At 400 ppm we have witnessed a rise in global mean temperatures of 1 Celsius (1.8 Fahrenheit). With every uptick in the CO2 counter climatologists expect annual mean temperatures to rise even further. And when you consider that this March was globally the hottest in recorded history it’s disconcerting to look at the snail’s pace level of progress our political leadership is making in addressing policy to begin to mitigate the growing crisis. How much longer can we be the frog in pot of water sitting on top of a stove burner?

On Mauna Loa the May 6th reading for carbon dioxide reached 404.1 ppm. Measuring CO2 began when geochemist, Charles David Keeling established it as an indicator to watch because of its heat trapping properties. The first reading in 1958 was 315.7 ppm. Since then it has steadily climbed.
Keeling was the first to note seasonal oscillation in CO2 levels. His memory will be honoured this summer with the unveiling of a plaque on the campus of the Scripps Institute where he worked. The plaque, given by the American Chemical Society, recognizes Keeling’s contribution to our understanding of greenhouse gases and the part they play in atmospheric warming.
It is pretty clear that the natural absorptive capacity of the planet’s many carbon sinks are no longer able to keep up with our industrial and technical society. The next steps humanity has to take is to start getting the emission numbers down even before the nations of the world meet in Paris. An emissions flatline, which may seem like progress, is not good enough.
The news of the 400 ppm milestone being surpassed in lots of places around the world is more evidence of energy demand growing globally at rates of 1 to 2% per year. The most optimistic forecasts of renewable energy sources achieving 10% of total capacity by 2030 cannot offset the production of greenhouse gases that will come from the continued burning of coal, oil and natural gas. Only the shuttering of fossil fuel-burning power plants will alter the balance and even then we may not see a decline in the Keeling Curve for a century with our natural carbon sinks already saturated.
Related articles across the web

In a New York Times article written by Justin Gillis on May 10, he quotes Dr. Maureen E. Raymo, a geologist at Columbia University. “It feels like the inevitable march toward disaster,” she states. Dr. Raymo points out that the last time the 400 mark was surpassed, based on the geologic record, was the end of the Pliocene, a period before the beginning of the Ice Age. In the Pliocene Africa’s Savannah was fully covered in forests. Ellesmere Island in the Canadian Arctic supported beavers, larch trees, horses and giant camels. Our planet was as much as 4 Celsius (7.2 Fahrenheit) degrees warmer than where we were in the mid-19th century at the dawn of the Industrial Age. And sea levels were higher, estimated to have elevated been 10 and 20 meters (33 to 66 feet). Dr. Raymo points out that even at the low end one quarter of the U.S. population would be impacted by such sea level changes.
Other reactions around the world have been variations on the same theme. Sir Brian Hoskins who heads up the Climate Change Committee at the Royal Society in the UK states: “Before we started influencing the amount of carbon dioxide in the atmosphere, over the last million years it went between about 180 and 280 parts per million…. Now, since the Industrial Revolution and more in the last 50 years, we’ve taken that level up by more than 40% to a level of 400 and that hasn’t been seen on this planet for probably four million years” Hoskins in his comments puts a positive spin to things stating, “around the world, there are things happening, it’s not all doom and gloom.” He is referring to what China is doing in its latest five year plan which sets a goal of reversing the environmental damage done by unprecedented growth over the last thirty years. For China this involves a heavy push to renewable energy and away from coal and fossil fuels.
Dr. Raymo as a geologist takes her perspective from the geological record of past ice ages separated by interglacial warming periods. She points out that it doesn’t take a lot of increased CO2 to get warming going. For example in the last interglacial period it took a few thousand years for the ice sheets on Greenland and West Antarctica to melt. The interglacial period lasted 30,000 years, three times longer than the one we are experiencing today. And at no time did CO2 levels approach 400 parts per million in those 30,000 years. She further states that even if we stopped the rise in CO2 levels today, that the atmosphere would continue to warm for centuries. “For me personally that’s the scary thing….we really don’t know what we’ve already committed ourselves to,” she concludes.
There may be some consolation for the climate change deniers. The 400.08 reading at Mauna Loa is the Earth breathing out in the annual cycle that is clearly visible on the Keeling Curve graphs (the plot below is of observations for the last week). That reading should drop below 400 later in the year according to James Butler of NOAA who is quoted in an interview with the BBC as stating: “Carbon dioxide has some variability on an hourly, daily and weekly basis, so we are not comfortable calling a single number — the lowest we will go is on a daily average, which has happened in this case…this is the first time the daily average has passed 400 parts per million at Mauna Loa. Probably next year, or the year after that, the average yearly reading will pass 400. In eight or nine years we will probably have seen the last CO2 reading under 400 parts per million.”

But climate change deniers, don’t feel too complacent. I leave you with the last word from Dr. Hoskins whose previous optimism in reference to China is countered by another recent statement,Given current human activity, levels of CO2 could be near 800 parts per million by the end of the Century.
]]>
The graph that appears below is known as the Keeling Curve, names after Charles Keeling, the scientist who began documenting fluctuations in atmospheric CO2 back in 1958. Mauna Loa is a good site to do atmospheric data collection because it is far from any major continental land mass. When Keeling started measuring back in 1958 CO2 levels were 317 parts per million. If you subscribe to the Twitter feed you can witness when CO2 passes 400.
We have only measured CO2 at Mauna Loa since 1958 but we can sample old air trapped as bubbles in ice cores from the Antarctic and Greenland. These bubbles date back to the Ice Age when CO2 concentrations varied from 200 to 300 parts per million. We also can measure historic CO2 levels using geochemistry allowing us to go back even further, millions of years in fact, to a time before humans existed. At that time between 3 and 5 million years ago, the Mid-Pliocene, mean global temperatures were 2 to 3 Celsius (3.6 5.4 Fahrenheit) degrees higher than today. The polar areas of the Mid-Pliocene were much warmer with temperatures 10 Celsius (18 Fahrenheit) degrees higher on average. With warmer poles, polar ice cap melting caused sea levels to rise between 5 and 40 meters (16 to 131 feet). As evidenced from the fossil record, tropical flora and fauna both on land and sea migrated toward the poles. Even Ellesmere Island, high in the Canadian Arctic, had forests where today there is just ice, moss, lichens, scrub grass and bare rock.
So in the next few months with the average annual rise of atmospheric CO2 at 1.9 parts per million we should see 400 breached and you can be alerted on Twitter the moment it happens. Something to tell your children and grandchildren about.
Al Gore writes in The Future, a book I recently reviewed, “Roughly a quarter of the 90 million tons of global warming pollution we put into the atmosphere each day will still linger there — still trapping heat — more than 10,000 years from now.”
It is a sad statement about our human nature that we choose not to solve this CO2 challenge by an all out effort to move away from fossil fuel-based energy generation. The problem and evidence is staring us in the face and yet only 2% of our present energy consumption comes from renewables today. The rest involves burning carbon. This carbon legacy will continue to be measured by the Keeling Curve in coming decades as we surpass 400 this year and watch the number climb to 450 by 2040 even if we mitigate our carbon burning ways starting now. And we must.
]]>


