It doesn’t matter whether you live in Las Vegas or Lytton, because early summer temperatures in both locales have been approximately the same. It makes sense that daytime temperatures exceed 45 Celsius (113 Fahrenheit) in Las Vegas, smack in the middle of the desert in the U.S. Southwest. But Lytton, British Columbia, is well north of the 49th parallel, in fact, more than halfway to the North Pole. Such temperatures at this latitude are unheard of. On one day this small Canadian village saw thermometers rise to 49.6 Celsius (121.3 Fahrenheit). A few days later a wildfire burned the village to the ground with the fires ignited by pyrocumulus clouds that form when there is a combination of excess heat and moisture in the upper atmosphere leading to frequent lightning strikes.
The meteorologists explained the phenomenon as a heat dome, which is a pile of warm air that doesn’t get pushed along by prevailing winds and settles over a geographic area, whether ocean or land, for days and sometimes weeks. The Jet Stream, the stratospheric wind current that flows across the North American continent, plays a part in the perpetuation of a heat dome. Instead of its normal flow pattern, the Stream elongates and flows more north-northwest to south-southeast in such a way that it blocks the warm air mass from its normal air movement west to east.
This heat dome which is finally dissipating spent a considerable amount of time over the western U.S., and specifically the Pacific Northwest, eventually expanding into western Canada. For a village such as Lytton, located in the Fraser River valley between mountain ranges, the effects of the heat dome became even more exaggerated with brilliant sunshine and no rain in the forecast.
A contributing author to this blog site told me where she lives in Oregon last week, the heat was overwhelming. Temperatures in Eugene and Portland, places where air conditioning is seldom needed, roasted as the mercury climbed to 44 Celsius (112 Fahrenheit). Seattle, Washington, a city that usually experiences summer daytime high temperatures in the low to mid-20s Celsius (70 to 75 Fahrenheit), recorded the hottest day ever since records have been kept, 38.3 Celsius (101 Fahrenheit).
National and local media outlets reminded us continuously of the unfolding story of a human tragedy of vulnerable people who could not escape the heat, dying from it. British Columbia reported a 195% increase in sudden deaths. Washington and Oregon reported 1,100 people in hospital with heat-related conditions.
So was this heat dome climate change in action? Or was it an aberrant meteorological event? Both President Biden and Prime Minister Trudeau, in public remarks, pointed to the link between these extreme temperatures and global warming. But we have had heat domes before. What made this one stand out from past meteorological occurrences?
This heat dome has been singularly bad because of when it occurred, at the time of the summer solstice, when the Sun in the Northern Hemisphere is high in the sky and its radiative force is most concentrated on the land and the air above it. The normal pattern of past heat domes showed a later occurrence in summer when solar radiation would be less.
Then there’s the behaviour of the Jet Stream. The Stream over the last few decades is exhibiting more variability in its pattern, what meteorologists and climatologists call wave resonance. The change is ascribed to a warming Arctic and Arctic Ocean, and the disappearance of sea ice.
Not to be forgotten in this meteorological event is the ongoing megadrought in the U.S. Southwest, and a general drying out of the continental U.S. west of the Mississippi River. The prolonged drought is being called an aridification event causing long-term changes to soil moisture and surface water resources.
So is this a one-time perfect storm or climate change happening before our eyes? Climatologists associate these types of heat events and their intensity and frequency, as indicators of global warming. IPCC reports note anthropogenic influences causing increasing heatwaves since 1950.
Is the Pacific Northwest alone in facing the heat? No! Far from it. Central Siberia has been experiencing its own heat dome this summer. Middle Eastern countries have seen daytime high temperatures this June of 50 Celsius (122 Fahrenheit) with a 52 Celsius (125 Fahrenheit) reading on one day as a daytime high in Pakistan. Even nighttime temperatures in all of these overheated locales are setting new highs. This is unliveable heat, more than halfway to the boiling point of water.
For scientists who study climate, questioning anthropogenic global warming, is no longer a subject of discussion. Professor Andrew Dessler, a climate scientist at Texas A&M University in an interview with Axios describes the debate as “not even an interesting scientific question anymore.” He goes on to state, “As the climate changes, that range is no longer the relevant one, and the mismatch between what we are adapted for and what we actually experience can generate huge negative impacts that seem to suddenly appear out of nowhere — even though we’ve been predicting them for literally decades.”
CarbonBrief has published a comprehensive piece on overall media reaction to these unfolding climate events. It is well worth reading.
]]>
Scientists have noted in several peer-reviewed studies that the Jet Stream in the northern hemisphere is not acting in a normal way. That’s why the last few years have witnessed sudden polar vortices that descend over parts of North America, Europe, and Central Asia, bringing abnormally cold weather for longer than normal periods of time.
It is a meandering Jet Stream that is seen as the cause. And now it is bringing Sahara Desert dust to the North Pole by pulling dust from North African cyclonic events and transporting the stuff in large amounts to the extreme north. The researchers note an increasing frequency in the phenomenon over the last few decades believing that change brought about by rising global temperatures is the primary cause.
The dust forms an aerosol that serves to dampen the normal radiative effect of Arctic ice. The Arctic is seeing more clouds as a result, which rain down grit in the form of carbon and mineral dust which is then deposited on the sea and land ice contributing to accelerated melt. The study states that “coarse size aerosol particles such as dust act like greenhouse gases by absorbing and emitting longwave radiation…..The longwave radiation plays a particularly important role in the energy balance in the Arctic because of prolonged polar nights with little or no sunlight.” The end result, radiative heating of ice surfaces with near-surface temperatures increasing.
The average lifetime of an aerosol particle from the Sahara can vary from days to weeks. Maximum concentrations occur during a period known as the Arctic haze season (late winter and early spring). The aerosols then accumulate as they rain out or fall to the surface where their physical, chemical and thermodynamic properties destabilize the ice surfaces.
The research shows that 60% of the Arctic dust appearing in the spring comes from the Sahara with a lesser contribution from the Taklamakan, Gobi, and other deserts. The mineral and carbon dust contributes to 24% of the absorption mass in the spring and summer contributing to thermodynamic changes in the ice.
This appears to be the first comprehensive study linking Saharan mineral and carbon dust to the Arctic albedo effect responsible for the shrinking of inland glaciers, ice shelves, and sea ice.
The authors of the study used observations from instrumentation on board the Meteosat geostationary satellite to compile the data, as well as data from the European Centre for Medium-range Weather Forecasts. From these sources, they were able to create a computer model that validated the distribution of Saharan dust from North Africa to the Arctic.
Our increasing understanding of the role the Jet Stream plays is significant as data we collect show an increased meandering “in a waveform pattern that allows the extensions of low pressure lobes and cold fronts much further to the south. …. These low pressure lobes can become stationary for a few days and block the normal circulation of the atmosphere.” It is this phenomenon that generates the dust storms in the Sahara and facilitates the transfer of aerosols to the far north.
We now know that here on Earth atmospheric dust can travel a very long way from its source. The phenomenon is not unique to our planet. In the past year, Mars has seen what started as a local dust storm grow into a global one that is only now, many months later, beginning to subside. The rover, Opportunity, may have been a victim of the aerosol storm that blanketed Mars. And recently images and data from the Cassini spacecraft show that a similar phenomenon is native to the Saturnian moon Titan.
While less dramatic than Mars or Titan here on Earth, and less obviously visible, we are witnessing a similar phenomenon on our planet and the movement of the dust poleward and westward is impacting the thermodynamics and albedo of the ice of Greenland, the Canadian Arctic archipelago, and the Arctic Ocean.

]]>
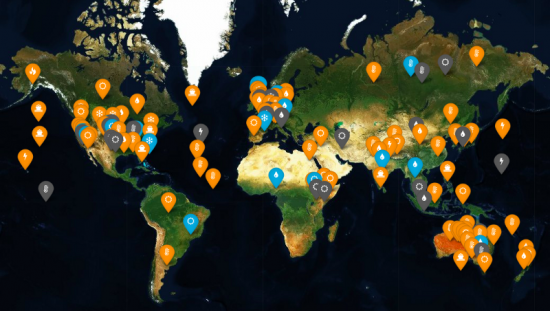
March 3, 2018 – The above map of the world attempts to illustrate the effects human activity is having on global climate. The map is the creation of Carbon Brief, a United Kingdom-based organization that covers climate science, and climate and energy policy. In 2017 its web presence was recognized by the Online Media Awards as the Best Specialist Site for Journalism.
All indicators highlighted on the map represent extreme weather occurrences. The ones in orange, the overwhelming majority, have been attributed to human influence. The ones in blue have no human influence attached to their occurrence. The grey ones are inconclusive.
The countries most affected by human-influenced extreme weather appear to be the United States and Australia. This attribution is not necessarily a reflection of a concentration of extreme events, but rather better scientific reporting in the affected countries. For example, Australian scientists are big into heatwave studies. Almost a quarter, 24%, of heatwave events are represented in the concentration of orange seen on the map. In only one case have scientists concluded that there was no human-causal link, and that was in the city of Melbourne, although as part of that study, the city of Adelaide further west indicated extreme weather influence from human activity.
The data points here represent 144 weather events compiled from 138 separate scientific papers. Of these, 68% have been made more severe because of human influences on climate. Nearly half, 46% of these events are related to heat. Heavy rainfall and floods represent 14%. Droughts make up 21%.
It should be understood that the human contribution to a weather event does not mean that humans caused the recorded extreme. And if an extreme event occurred in an area it doesn’t mean that there is a greater likelihood of a repeat each year.
Also note that there are no site markings in the extreme north above the Arctic Circle where sea ice melt is associated with changing conditions there, along with speculation related to occurrences of polar vortices in areas where they are not commonly seen. For example, the current “Beast from the East” plaguing Europe, a winter storm so severe in this last week that it is bringing the business of the continent to a halt. Could this be human-influenced, a consequence of a warming world ocean escalating Arctic sea ice to retreat, and causing Jet Stream oscillations that draw down colder air to places where it infrequently occurs?
How bizarre is this latest European weather event? In February the extreme north on nine separate days experienced above zero Celsius temperatures, 30 degrees warmer than the norm in the Arctic winter. This warm air intrusion during a period of winter darkness also led to record warmth in Siberia with temperatures as much as 35 Celsius above average. The northern tip of Greenland remained above freezing for 61 hours, three times longer than in any previous year.
The displacement of cold air by warmer air in the Arctic ended up pushing the former into Europe and parts of North America. Where the latter has experienced these polar vortices in recent years, the phenomenon is new to Europe. And not only does cold air displace the warm air, it also alters wind patterns. In the case of the latest European storms, westerly winds have been reversed to become easterly.
In the United States, weather forecasters blame air from Canada when a polar vortex arrives. In Europe, the blame game looks at two culprits. First, there is the Siberia effect, and second, Scandinavia, where the cold high pressure, normally over the North Pole, now firmly has implanted itself over Norway, Sweden, and Finland.
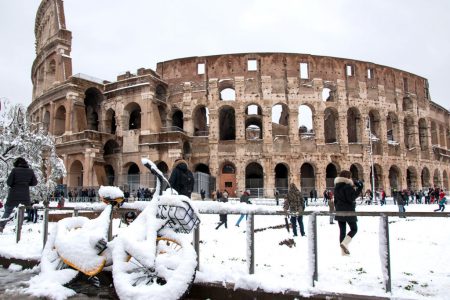
As Arctic sea ice continues to disappear the Jet Stream will be further weakened allowing cold air to drop into the mid-latitudes in the Northern Hemisphere. For climate skeptics, who point to every low temperature as validating their arguments that global warming is a fiction, polar vortices represent ammunition. The nonsense of this only becomes apparent when climatologists describe the correlation of changes to the Jet Stream from rising ocean temperatures globally and particularly in the Arctic. The warming ocean correlates with the increased warming of the air above it from the tropics to the mid-latitudes. This warming extends throughout the entire vertical water column to the ocean depths. Combined with the warming is the increased amount of carbon entering the world ocean absorbed from increases in carbon dioxide in the atmosphere. It’s all interconnected and only the foolish and blind-sighted don’t see the correlation to human activity.
Where research has been looking at aviation’s contribution to greenhouse gas accumulations in the atmosphere, not very much investigation has gone into the impact of atmospheric warming on business operations. Some studies have investigated how rising sea levels may cause coastal airports to relocate or build berms and sea walls. Others have studied how the heat-island effect over airports has impacted the calculation of takeoff weights. And others have looked at lightning, snow, ice and the disruptive impacts of these natural phenomena on scheduling, flight altitudes, and lane routing. Most recently researchers have studied the changing behaviour of the Jet Stream in light of impacts of global warming at the poles, a subject I covered in a
Most recently researchers have studied the changing behaviour of the Jet Stream in light of impacts of global warming at the poles, a subject I covered in a March 29th posting here on the 21ast Century Tech blog. Another characteristic change in the Jet Stream is the strengthening of winds in the mid-latitudes of both the Northern and Southern Hemispheres. Here tropospheric and stratospheric warming and cooling are causing unprecedented thermodynamic effects on winds. This not only is leading to more extreme weather events as seen in thunderstorms and hurricanes, but also in “clear-air turbulence.”
What is clear-air turbulence?

It is the movement of air masses in a turbulent manner in the absence of clouds or other weather phenomena. In the past clear-air turbulence has been most associated with airplanes passing through the Jet Stream. And anthropogenic climate change is seen as an enabler of the phenomenon. Climate models indicate increasing moderate or greater turbulence on Trans-Atlantic flights, particularly in the Northern Hemisphere’s winter season. The numbers at the low end are 40% with a high end of 170%. The current median length of time in which clear-air turbulence is experienced amounts to 5 minutes or 60 kilometers (37 miles) in distance traveled. And the median thickness of clean-air turbulence is about 1 kilometer (0.6 miles) in vertical height.
There are 790 turbulence encounters reported by United States air carriers annually today. These result in over 680 minor injuries and 38 serious ones to flight attendants, and 120 minor injuries and 17 serious ones to passengers. Unreported clear air turbulence injuries are thought to be much higher considering records show 63,000 moderate or greater turbulence, and 5,000 severe or greater episodes annually. Incidents of damage to aircraft plus injuries to passengers and crew today cost American carriers almost $200 million per year. When you consider that global air traffic has been growing at a rate of 5% per year, and expected to continue at that pace for at least two more decades, increased turbulence becomes not just a safety problem but also an economic one.
In the current study which focuses on air traffic across the North Atlantic, the modeling indicates with doubled levels of atmospheric CO2 from pre-Industrial times, the following results:
No one is suggesting that CO2 will double to 500 ppm in this century, which is approximately a doubling from the pre-Industrial period in human history. But we are already at near 410 and climbing. Without dramatic cuts in carbon emissions, the concentration of CO2 is likely to hit 450 by mid-century. That’s not far off from the 500 ppm model which produced the extreme results described above.
One would also expect that the duration of clear-air turbulence and the thickness of the air column in which the turbulence occurs will also be impacted.
So how is the industry preparing itself for increasing turbulence?
On-board detection of clear-air turbulence technology may become standard equipment on all aircraft. Forward-looking LIDAR (Light Detection and Ranging ultraviolet laser) will be able to warn pilots of changes in air density indicative of clear-air turbulence up to 10 to 15 (6 to 9 miles) before it is encountered. This may allow pilots a little more than a minute at cruising speeds to alter course or advise passengers and attendants of the phenomena. The economic cost of retrofitting airline fleets to have on-board LIDAR will make flying more expensive.
The unknowns of how increasing incidents of clear-air turbulence may affect the normal atmospheric exchange between troposphere and stratosphere, the formation of clouds, frequency of thunderstorms and other extreme weather, and larger atmospheric circulation, have yet to be explored. And because this new study is specific to looking at winter seasonal air turbulence on Trans-Atlantic routes, the authors suggest that other seasons and other geographic areas need to be examined similarly.

The study’s authors describe “persistent episodes of extreme weather in the Northern Hemisphere” as being associated with changes in the dynamics of the Jet Stream. The authors write that their discovery “adds to the weight of evidence for a human influence on the occurrence of devastating events such as the 2003 European heat wave, the 2010 Pakistan flood and Russian heat wave, the 2011 Texas heat wave and recent floods in Europe.”
So how can global warming alter the Jet Stream? If you are not familiar with the Jet Stream, it a high-altitude flow of air that goes from west to east in the Northern Hemisphere driven by Earth’s rotation and the temperature gradient between the North Pole and the Equator. In recent years Arctic amplification has seen a higher pace of warming in Northern Latitudes than at the Equator. This changes the resonance of the wave which characterizes the Jet Stream’s flows. Instead of sinuous within a narrow range of latitude, the Stream has become elongated and weaker. Hence when the Stream dips well south of the norm it draws down colder air from the poles. And when it sinuously climbs into high northern latitudes it draws up warmer equatorial air. That extreme of waviness is “resonant amplification.” What’s occurring is not a weakening of the waveform, but a strengthening that eventually reaches a point where it remains in place for longer than normal periods of time rather than getting cut off and reforming with a less sinuous appearance.
The study confines itself to looking at weather extremes in spring and summer and not winter phenomena. The authors suggest that other mechanisms may contribute to winter atmospheric behaviour over and above “quasi-resonant amplification” of the Jet Stream’s natural wave.

This is not the first paper to describe evidence of a link between Arctic amplification and extreme weather in lower latitudes. It is, however, the first to show the mechanism for the phenomena.
In their conclusion, the authors of the study write, “our analysis of both historical model simulations and observational surface temperature data, strongly suggests that anthropogenic warming is impacting the zonal mean temperature profile in a manner conducive to wave resonance and a consequent increase in persistent weather extremes in the boreal summer. Combined with other additional proposed mechanisms for climate change impacts on extreme weather, this adds to the weight of evidence for a human influence on the occurrence of devastating events.”
Maybe Donald Trump, or someone who talks to him, can now explain why some days it can be cold outside because of global warming.
]]>So what’s weird? Well the Arctic above 80 degrees north is now dark 24 hours a day. This should be deep freeze time but strangely it isn’t. Take a look below at the temperature graph recorded Tuesday, November 15th by the Danish Meteorological Institute. The Danes who own Greenland are leaders in studying changes to the Arctic.
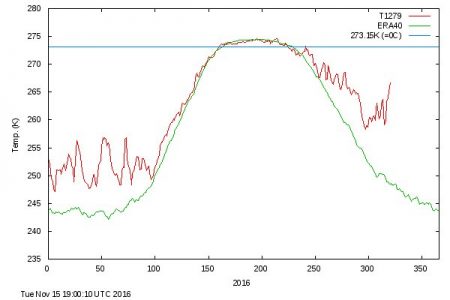
The red line traces daily mean temperatures. Note the unusual nature of the plot line when compared to the green line beneath which represents mean historic temperatures plotted over a 45-year period beginning in 1957 through 2002. Daniel Swain, climate scientist at UCLA describes what is being observed as “extraordinary.” Temperatures are 20 Celsius (36 Fahrenheit) warmer than normal over most of the Arctic Ocean. A similar spike was observed in 2015 but this one is even more extreme.
What could be the cause?
Speculation is low sea ice, thin sea ice, and a jet stream that no longer acts the way it has in the past. Low sea ice exposes more ocean water to the air above it acting as a heat exchange. Thin ice absorbs more solar energy when the Arctic is in daylight because it is more transparent. And less ice means greater ocean turbulence which further depletes ice coverage.
The excessive warmth in the Arctic combined with the jet stream oscillations is causing extreme cold in Siberia. Meanwhile Canada’s northern archipelago is seeing warm air sweep northward. The pattern has been continuous since October. On Alaska’s North Slope average temperatures are 2 Celsius (3.6 Fahrenheit) above records previously set in 1998.
The October warmth which was considered unusual is now being matched by even greater warmth in November during the season of darkness. Some areas of the Arctic Ocean are experiencing temperatures 14 Celsius (25 Fahrenheit) higher than normal.
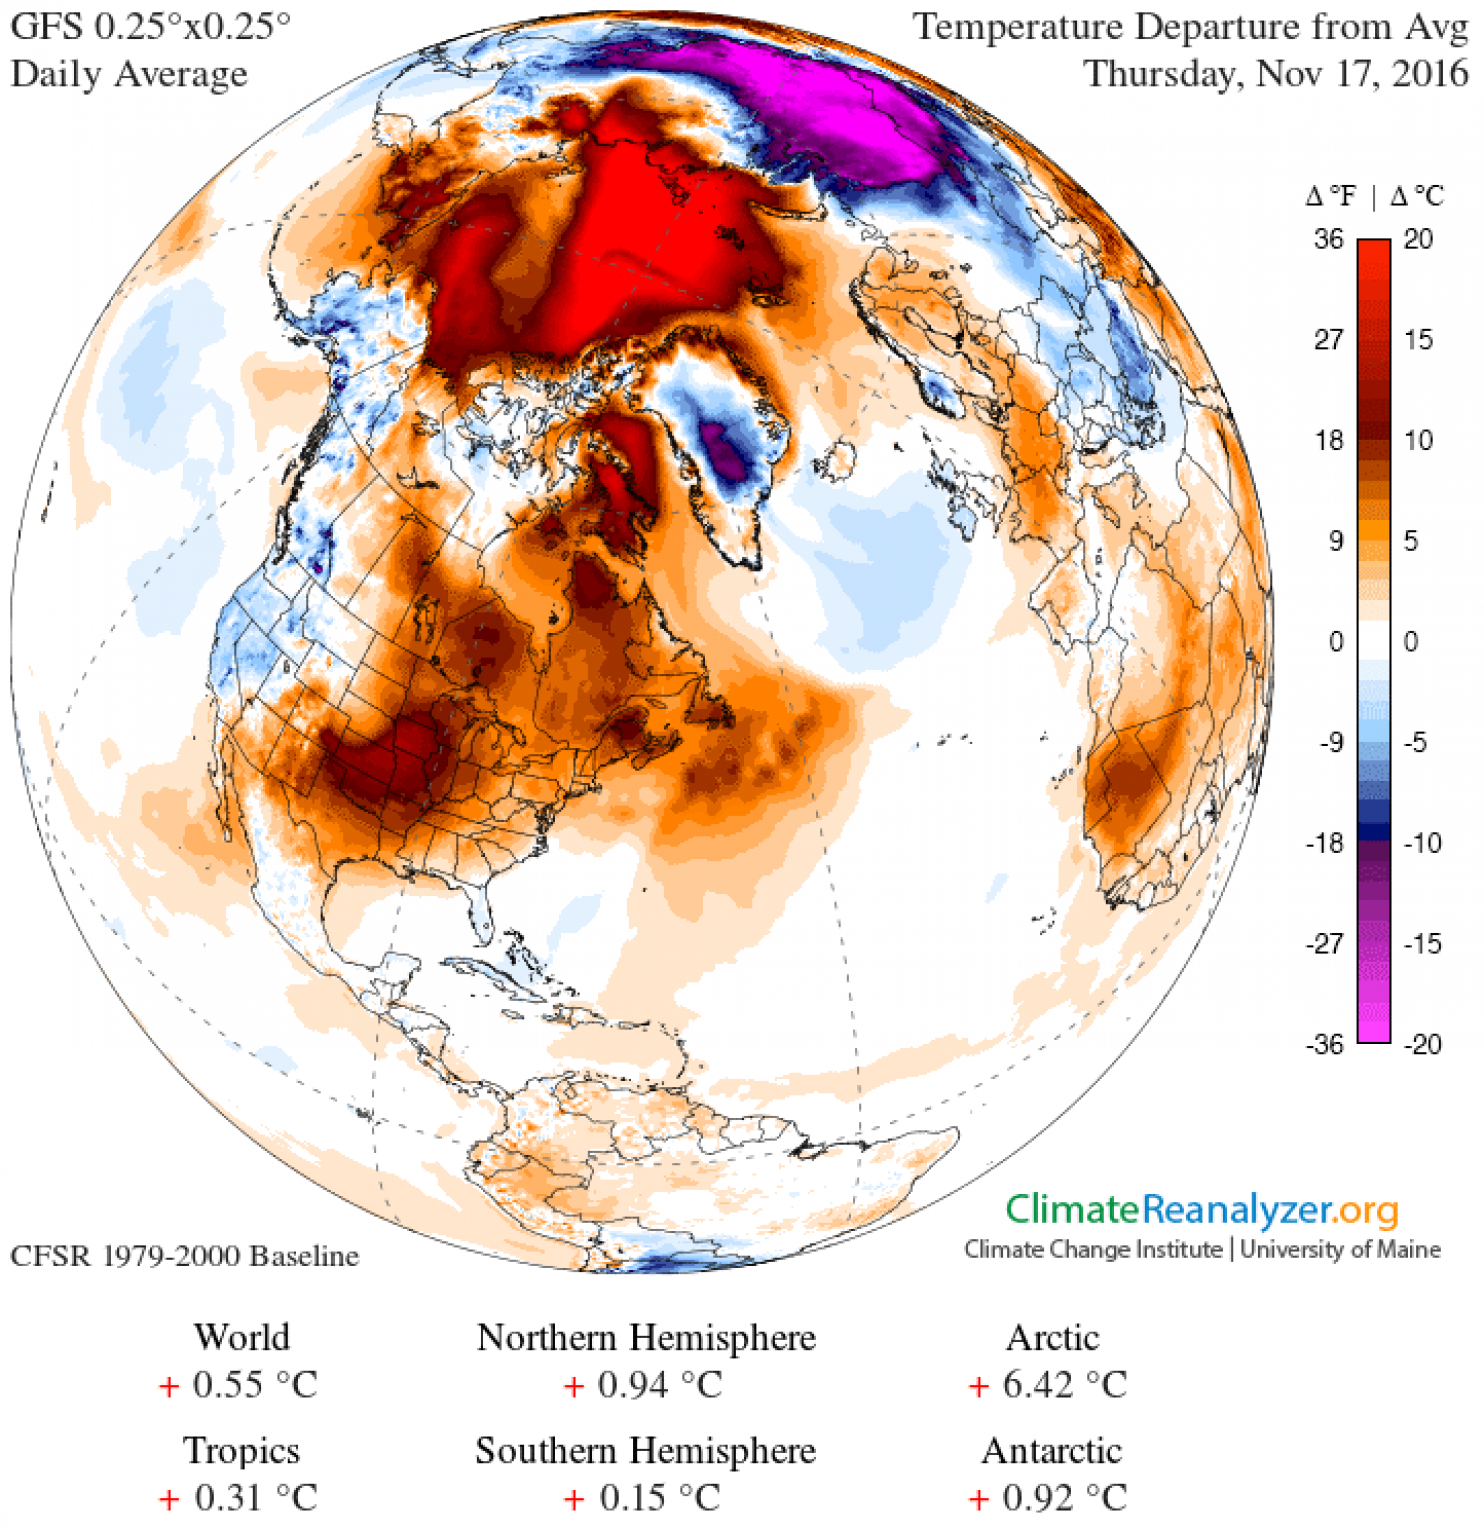
The University of Maine has created a global view of the wacky weather we are experiencing in the Northern Hemisphere. The image below shows temperature departures from the norm for Thursday, November 17. The scale on the right displays the delta from the daily average. Note the amount of red over the Arctic Ocean and the purple over Siberia, two very different extremes.
The weirdness may continue because the longer it takes for the sea ice to reform the more likely temperatures will stay well above normal. This could set up the Arctic in 2017 to sea even more spectacular drops in sea ice coverage. Of course we could see the whole thing reverse but the trending is pointing to a very different scenario of increasing warmth and diminishing sea ice down 7.4% per decade since 1980.
For those of you in eastern North America wondering what that will mean for our winter. The El Nino is no longer a factor this year so the warm and dry winter that the Great Lakes experienced is probably not going to happen. In February last winter we saw what a wobbly jet stream does drawing down a fearsome blast of Arctic cold to the northeast. Climate projections suggest we may see a repeat of these polar vortices this winter with pulses of cold air similar to what Siberia is currently experiencing.
One of the indicators of a warming atmosphere is that weird becomes the new normal.
May in Toronto was one of the driest on record until yesterday when we almost made up the volume to equate with an average month, most of it falling in one day. This continues to be the new normal in Toronto where we experienced a deep freeze in February and a very late spring, a frost in late May that killed some of my flowering potted plants and a good percentage of the wine grapes in the Niagara Peninsula just to the south of the city.
How does the pattern of the Jet Stream relate to weather extremes in North America?
In our data keeping on the Jet Stream the pattern of the last decade is decidedly different from the past. The occurrence of a pattern of upper atmospheric air movement that curls and dips into the mid and semi-tropical latitudes is pulling lower atmospheric air from polar regions driving it south. This languid oscillating movement is pushing warm dry air into the Pacific Northwest and drying out much of the United States Southwest in the process.
Climatologists believe increasing Arctic sea ice melt and with it the longer exposure of open water to the atmosphere and solar heating is playing a part in altering high atmospheric wind patterns. Arctic summers are getting warmer faster than any other place on the planet. If the jump in mean temperatures at mid-latitudes is 1 degree Celsius (1.8 Fahrenheit), its counterpart in the Arctic is closer to 4 to 5 degrees Celsius (7 to 9 Fahrenheit). That warming means weather patterns over the Arctic are being altered.
At the same time we have the oscillations of El Nino and La Nina events in the mid-Pacific with winds driving the air above the warming ocean into western North America, and counter winds driving warmer ocean water into the Indian Ocean with some implications for weather in that part of the world. We’ll get to that in a minute.
So Toronto isn’t alone in experiencing “extreme,” the new normal.
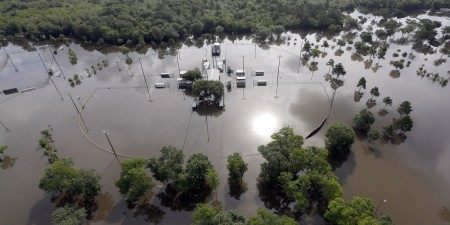
Look at the headlines of the last couple of weeks. A decade long drought in Texas and Oklahoma comes to an abrupt end when historic high rainfalls inundate these states causing massive floods, leaving thousands homeless and killing dozens.
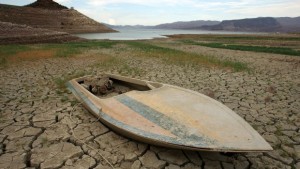
In California climatologists describe the drought crisis in terms that begin with the prefix “mega.” One scientist recently described the situation as no longer being “up a creek without a paddle” but instead “we’re losing the creek too.”
In Northern Alberta, where forests have been devastated by Mountain Pine Beetle, now surviving warmer Canadian winters to reproduce twice a year, tinder-dry conditions combined with unprecedented warm and dry weather have led to a devastating outbreak of 63 wildfires isolating communities, causing evacuations and halting 10% of all oil sands production in the province. The wildfires with no vegetation to hold the mountainsides contribute to mudslides when the occasional rain falls.
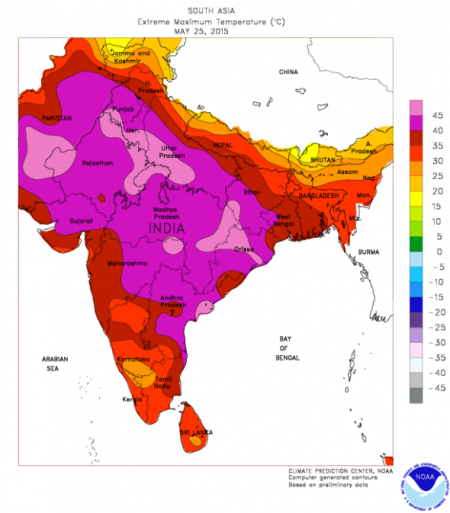
And in India, the May heat that normally precedes the onset of the annual monsoon turns deadly with daytime temperatures approaching 50 degrees Celsius (122 Fahrenheit) leading to more than 2,000 extreme heat deaths. Indian climatologists describe 2014 as the hottest year on record and predict heat stress will continue to grow through the mid-century further exacerbated by rural to urban migration where the urban heat island effect will make things even more extreme. Forecast higher temperatures in the 2020s – 50+ Celsius and by 2080 – 55 Celsius (131 Fahrenheit).
Is extreme weather attributable to global warming and climate change?
Scientists have been cautious to date in linking the two. They have avoided associating events like Hurricane Sandy and Katrina with global warming. Instead they have argued the likelihood of extreme weather events may go up when oceans get warmer and the air over them gets stirred up.
But now some are throwing caution to the wind making statements that argue that climate change affects all weather and storms. Kevin Trenberth, a climate scientist at the U.S. National Center for Atmospheric Research, in Boulder, Colorado, states that weather and storms “cannot not be affected. The risk of drought and flood is greater, and so are heat waves and wildfires. There is excellent evidence for all of these things happening.”
In the most recent research papers on climate some scientists are attributing 75% of the world’s hottest days and 18% of precipitation extremes to climate change. In an April posting to letters in Nature Climate Change, entitled, Anthropogenic contribution to global occurrence of heavy-precipitation and high-temperature extremes, the authors demonstrate that global warming and observed increases in extreme weather are inextricably linked. They state, “Significant trends in temperature and precipitation extremes over the recent decades have been observed and attributed to human influence. Although none of these extreme events was exclusively anthropogenic in a deterministic sense, climate change has changed their odds, which can be expressed as a change in the fraction of attributable risk.” The percentiles at the beginning of this paragraph are theirs.
The implications for a mid-latitude country like the United States are enormous. With the pattern of demographic change flowing from the northeast to the southwest, the U.S. will be increasingly subjected to extreme heat days and extreme heat deaths as the population continues to age. In a paper published on May 18th of this year in Nature Climate Change, researchers project a four- to sixfold increase in extreme heat exposure in the continental United States by the latter half of the 21st century. They attribute their forecast to climate change and population redistribution.
And if you by now are not convinced that atmospheric warming and extreme weather correlate then consider the following tornado study that looked at multiple-tornado day frequency. It appeared in the August 2014 issue of the journal, Climate Dynamics. Researchers studying tornado occurrences found sufficient evidence to link the occurrence of multiple-tornado event days with atmospheric warming and state, “The bottom line is that the risk of big tornado days featuring densely concentrated tornado outbreaks is on the rise….consistent with numerical modeling studies that project increases in convective energy within the tornado environment.” Convective energy, just another way of saying global warming.
Climate change isn’t today’s or tomorrow’s weather. Climate change is the analysis of the dynamic changes in our physical world and its surroundings. Climate change looks at our Sun’s energy output, at Earth’s axial wobble, at atmospheric composition, at ocean currents and thermodynamics, at changes to planetary biomass. Climate change models all of these variables and creates simulations that cover years and decades, not days.
Sometimes even the best scientists confuse us all when they point to a hurricane and say “this is evidence of climate change.” A single hurricane is not! A trend over decades that tracks changes to hurricane frequency and intensity may very well be!
In the December 2014 issue of Scientific American, an article entitled “The Jet Stream is Getting Weird“ explains the winter of 2013-14 polar vortex as a weird change in the pattern and flow of the polar jet stream.
If you are not familiar with the jet stream it is an ever present wind that circles our globe some 9 to 14 kilometers (approximately 5.6 to 8.7 miles) above the surface of the Earth. There are two of these in each of the northern and southern hemisphere. One is located at high latitudes and the second in the mid-to-low latitudes.
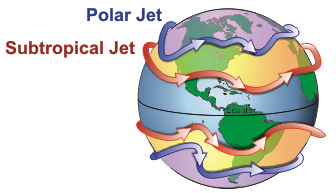
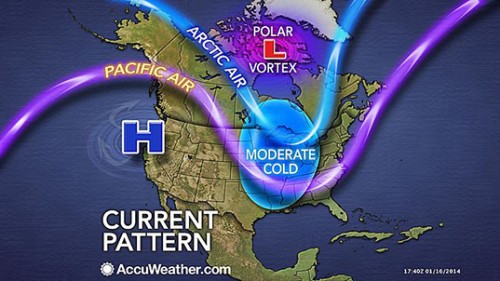
Our weather experiences are largely the product of systems that follow the path of these jet streams. Just look at any weather map (see below) and where you see ridges of high pressure and troughs of low pressure you can impose on that same map the jet stream (seen in blue) in lock step.
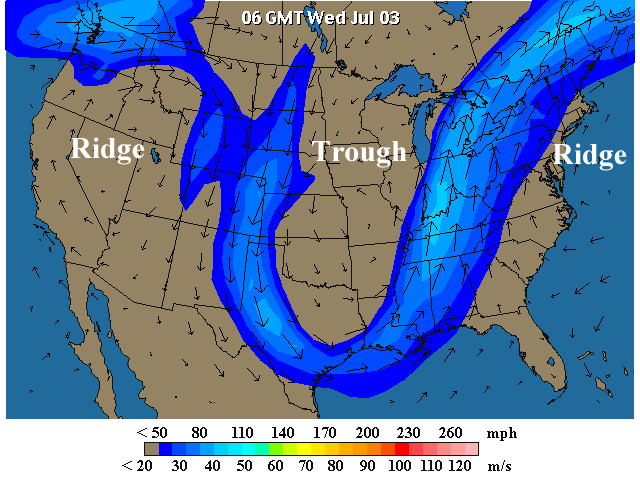
The one closer to the poles is the subject of the Scientific American article. It describes a jet stream contorted beyond anything previously measured leading to “outlandish weather.” The Polar Vortex of last winter that dropped temperatures in Eastern North America to the point that the Great Lakes almost froze in entirety, a very rare event, is blamed on a stalled jet stream that maintained a weird weather pattern for weeks on end.

Is a stalled contorted jet stream an indicator of climate change? It may very well be. That’s because big atmospheric forces influence it and the persistence of an altered pattern in its track could be symptomatic of our altering atmosphere. But it also may be a symptom of the cyclic nature of a number of variables such as solar intensity, axial wobble and phenomena such as the El Nino and La Nina events which occur every few years in the western Pacific Ocean and subsequently set off a chain reaction that impacts North America.
The Polar Vortex of last winter and the changing pattern of the jet stream were more than coincidence. The cause remains controversial. Was the melting of Arctic Ocean sea ice primarily responsible? Meteorologists have noted in numerous studies that Arctic amplification of the atmosphere in northern latitudes has been in evidence for the last 15 years. But there is no consensus as of yet that this is derived directly from the shrinking summer sea ice. That’s because the observed energy gained in the atmosphere from increased warmth over the open sections of the Arctic Ocean is not seen to be sufficient enough to drive the kind of changes observed in the wobbling of the jet stream. It could just be natural variability. After all North America and Central Asia have experienced long winter cold snaps in the past.
So this is where it gets hard to determine if what we saw last winter was weather or climate change. We need more data observed over a longer period to make the call.


