I haven’t been totally idle while remaining with my leg elevated. Instead, I have been catching up on my reading about our changing climate, the mystery surrounding the SpaceX Zuma mission, the latest non-science bashing genetically modified organisms, and, of course, Donald Trump.
One study that caught my eye comes from NASA, the agency that the current administration wants to stop looking at the Earth and instead look to the Moon and Mars. NASA’s Earth science portfolio is very deep. Satellites it has launched study greenhouse gas levels in the atmosphere, the state of our oceans and continents, weather and climate, land use, deforestation, and more.
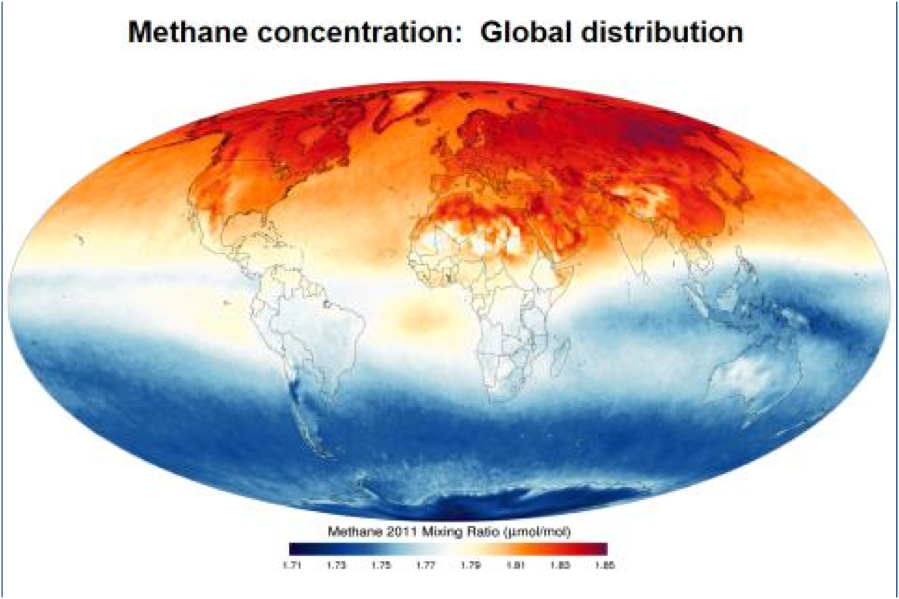
The latest from NASA to be published is a study of atmospheric methane (CH4), a greenhouse gas that doesn’t endure in the atmosphere as long as carbon dioxide (CO2), but nonetheless, contributes to global warming. And CH4 has increased in the atmosphere at a rate of 25 teragrams annually since 2006.
What’s a teragram? One is equivalent to 1 million metric tons (1.2 million American tons). So CH4 emissions have been accumulating at a rate of 25 million metric tons each year for more than a decade. When compared to CO2 accumulations over the same period 25 million tons is a blip. That’s because CO2 contributions amount to more than 25 gigatons annually and a gigaton equals a billion metric tons. That latter contribution accounts for 82% of all greenhouse gas emissions produced from human activities.
So why worry about 25 million tons of CH4?
Here is an interesting statistic. Although CH4 contributes a mere 1% of the amount of greenhouse gases entering the atmosphere, that small percentage translates to 9% when weighing the total impact the gas has on global atmospheric warming. In other words, CH$ has a nine times greater impact per ton than CO2.
CH4 comes from many sources; wetlands, swamps, mangroves, tidal ponds, Arctic permafrost, fossil subsoils, underground natural gas reservoirs, the digestive tracts of ruminants (cows), and from fermented manure used as fertilizer on farms. It also is a common byproduct of forest fires like those that have stricken parts of Southern California in the last two months.
The signature of CH4 from every source can be isotopically isolated. So we know the difference between CH4 from cow farts and CH4 from a gas wellhead. This gives NASA scientists the ability to accurately measure origins which they do using satellite and ground-based imaging spectrometry. The collected data shows that the observed global rise in atmospheric CH4 is largely attributable to oil and gas exploration, production, and distribution. Of the 25 teragrams of CH4 being added to the atmosphere annually, NASA data indicates that 17 is derived from oil and gas.
Should we be worried?
If we continue to expand oil and gas exploration as is evident in the policies of the current Trump government in the United States, then indeed we have a problem.
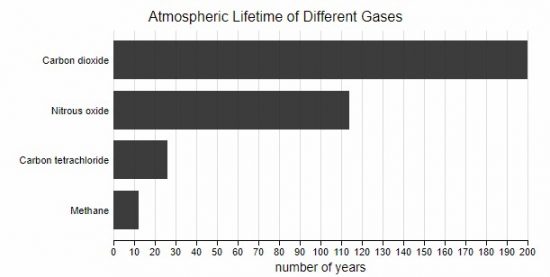
Surprisingly, the study doesn’t include data about CH4 short atmospheric life. When compared to CO2, CH4 hangs around as a greenhouse gas for 12 years before it breaks down through natural processes, whereas CO2 hangs around for up to 200 years if not trapped in natural sinks or by human-created carbon sequestration technologies that have yet to exist.
Scientists describe CH4’s warming as short and sharp while attributing words like “creeping” and “insidious” when talking about increasing CO2 in the atmosphere.
Contributors, other than NASA to this study, include the National Center for Atmospheric Research, Boulder, Colorado, the Netherlands Institute for Space Research, and the University of Utrecht, also in The Netherlands.
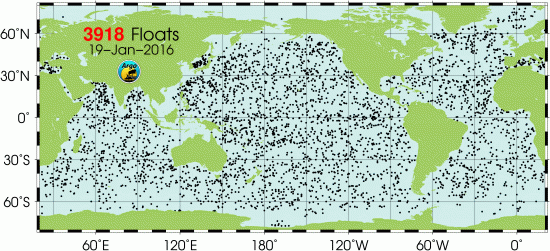
Right now 35% of the heat generated by greenhouse gas emissions is going to depths below 700 meters and the distribution of a global ocean-wide network, the Argo Programme, consisting of 3,918 floating sensors (see map below), is giving us the best picture we have ever had of the impact on the planet.
In a paper entitled, Industrial-era global ocean heat uptake doubles in recent decades, researchers from Lawrence Livermore National Laboratory, Princeton University, Penn State and the NOAA Pacific Marine Environmental Laboratory, studied the data from a fleet of surface and deep ocean sensors gathering temperature, salinity and acidification measures. Some of the sensors reached depths of over 6,000 meters (20,000 feet). In their observations they note that although the actual temperature rise globally is small, the capacity of the ocean to absorb heat, is “huge” as our friend Donald Trump would say.
The graph appearing below indicates just how much warming has occurred. From the network of smart buoys we can trace a doubling in ocean heat uptake since 1997. The current El Nino is part of the phenomenon as the ocean exhibits spikes in its warming rate. It makes me wonder what the Donald would think about his climate change position if he were to study the results of this paper? Could he continue to deny what scientists in his own country and the Argo technology, also a product of the United States, is showing?

Observes John Shepherd, Earth System Scientist at the National Oceanography Centre, University of Southampton, in the United Kingdom, “once the ocean heat uptake settles down again, the rate of warming is likely to return to what it was before.” That rate of warming he is referring to is the once that appeared to hit a lull in rising atmospheric temperatures observed in recent years. But in fact the lull has largely been discounted in further research. Shepherd, however, makes a more poignant argument when he states, “the extra heat will either remain in the ocean, where it may affect both ocean and atmospheric circulation patterns, and so contribute to unusual weather patterns like El Nino, or it may be released to contribute to more rapid or prolonged warming later on. It’s certainly not a cure for climate change.” His conclusion, if it hasn’t escaped notice, is that the ocean is a finite carbon heat sink. At some point there will be consequences.
The most disturbing observation from this journal paper is the data that shows warming in deeper layers of the ocean. Our human generated greenhouse gases are no longer an atmospheric and ocean surface phenomenon. We are now driving heat deep into the abyss.
At COP21 the 190 plus countries on the globe pledged to establish targets to begin lowering carbon emissions starting in 2021. That is all well and good. But what it doesn’t stop is latent heating from existing atmospheric greenhouse gases which the ocean is continuing to absorb. The impact on ocean biodiversity is as of yet not fully understood. Yes we are seeing coral bleaching and species decline. But how many will fail to adapt to the rising water temperatures we have created? How much of the Earth’s marine life will we lose before we can reverse the process?

———-
In February of this year, the Kent Fire Department in the state of Washington was featured for their dedication to a greener world because they switched from gasoline fueled vehicles to two Nissan Leafs. The idea was that these cars would help reduce the fire department’s carbon footprint because they would produce no emissions and require less maintenance. Using these cars today was seen as making Kent greener.
It can be argued, however, that quite the opposite is true. In a recent Scientific American podcast, authored by David Biello, the notion that electric vehicles (EVs) are cleaner is questioned. It stated that a “host of factors determine the role of electric and hybrid cars in reducing greenhouse gas pollution.” This means that EVs and hybrid cars provide no guarantee of a greener tomorrow. In fact, the two technologies may make the environment worse depending on how much coal is burned to create the electricity stored in EV batteries, and the impact of disposing or recycling the materials contained in the batteries.
The reason why scientists are skeptical about this matter is because advances in battery technology are not happening fast enough. Will batteries get lighter? Will they be cheaper? Will the chemicals and materials used in them be more environmentally friendly? Can batteries answer the energy demand of our future world?
Much depends on governments committing themselves to putting limits on carbon dioxide. Only then will coal-fired power plants no longer be the energy source for recharged EVs. In some sense today’s EVs in the United States run on coal because coal-fired power plants remain the largest source of electricity.
In the Scientific American podcast it mentions that researchers ran 108 different computer simulations on how driving might change in the next few decades. According to the results, it would seem that the key to reducing carbon dioxide and other greenhouse gas pollutants isn’t dependent on how many EVs people use. What matters most is whether or not regulations are in place that enforce emission reductions. This means cars, as many people would think, aren’t the biggest greenhouse gas threat. Factories, power plants and power-hungry machinery running on energy from coal and other fossil fuels are if anything a bigger factor. That’s why turning to EVs alone is not enough to green the United States, not unless government legislation mandates carbon emission reductions for the entire economy.

]]>
The formal announcement on reduction pledges is expected at the G7 meetings planned for June in Germany. This is not as significant a reduction as Japan intended before the Fukushima nuclear disaster in 2011. Before the earthquake and tsunami shuttered Japan’s nuclear power plants the country was committed to emission reductions of 25% below 1990 levels by 2020. But right now Japan has reverted to relying on coal-fired power plants to make up the energy loss from its nuclear facilities. It is a touchy subject in Japan, when those nuclear power plants (not Fukushima) will once again be turned on. This may happen this year.
For Japan, the world’s fifth biggest greenhouse gas emitter, a 20% reduction will not help the world meet its target of no more than a 2 Celsius (3.6 Fahrenheit) rise in mean global temperatures. The Japanese branch of the World Wildlife Fund has pushed for target reductions of 50% from 2005 levels by 2030. But the uncertainty over nuclear remains the major stumbling block.
Japan is one of 34 countries to announce greenhouse gas reduction goals in the last month. Last week it was Russia (the world’s number three emitter) and the United States (number two). We are still waiting on China (the world’s number one emitter) which has yet to set reduction targets other than the bilateral agreement it established with United States a few months ago. India (number four) Australia (number seventeen) and Canada (number nine) are also shirkers in pledging national greenhouse gas emission reduction goals.

Anthropogenic (that is human produced) methane comes from many sources. These include the mining and burning of fossil fuels, farming, and gases emitted by garbage at landfill sites. It is estimated that 60% of all methane in our atmosphere is derived from human activities.
Methane tends to dissipate much faster than CO2. An average molecule lasts eight to nine years before it oxidizes. That makes methane harder to measure and that’s why methane tends to be measured at the source rather than the way we measure CO2. But are we accurate in our measure? And do we truly understand methane’s contribution to global warming?
The Environmental Protection Agency (EPA) of the United States, which calculates the amount of methane released through human activity, is being called on the carpet by a recent university study that appeared in a November 2013 issue of the Proceedings of the National Academy of Sciences. It appears that the EPA has seriously underestimated the amount of methane released through human activity in the United States. In fact total amounts appear to be between 1.5 and 1.7 times higher than EPA figures.
The miscalculation may be the result of different methods used to collect data on the GHG. The study summarily dismisses EPA data and that provided by the European Commission’s Emissions Database for Global Atmospheric Research, known in short as EDGAR. The data the EPA and EDGAR provide look at source emitters of methane. For example they have a calculation for the average yield of methane from rumination per head of cattle, or the average amount of aerated gas from oil and natural gas wellheads, or the amount emitted from coal mine operations or landfill sites. The study results do not approach the measure of methane this way. Instead the approach is top down, measuring the total concentration of methane in the atmosphere in similar fashion to how we measure CO2. But because methane oxidizes in a short period of time the amounts vary by year considerably.
If both U.S. and European oversight have got it wrong, what about the rest of us studying methane on the planet? What other countries and continents are taking measure of methane output? How consistent is the methodology?
Well it appears that some countries are very much aware of the methane contribution of their dairy and non-dairy cattle. Some are measuring methane output as well from pig farms. Others are measuring methane from fracking wellheads. Some are collecting methane captured from landfill sites. But it appears the measure of methane seems largely dependent on national or institutional preference.
How about the remaining 40% that is not human produced? Most of that methane comes from plant decay from natural wetlands. But even more of the gas is trapped in permanently frozen soils in the sub-arctic of Canada, Alaska and Siberia. This permafrost may not be so permanent after all. Trending to more significant warming in the Arctic may eventually lead to significant amounts of methane release over the coming decades. And although methane does not have the staying power of CO2 it will further destabilize our climate.
The global community, therefore, needs to understand just how much methane we humans are producing and find ways to lessen those amounts. We know that methane has increased in the industrial age. We know this increase is anthropogenic. And we know there are ways we can reduce methane release. Some of these are:
Addressing the natural release from permafrost, however, is a much tougher assignment for which there appear to be no easy solutions. And if we should start mining methane hydrates from the ocean floor we could be opening a Pandora’s Box.
For those who believe that the CO2 we produce will actually improve plant growth the study provides a sobering conclusion.
Professor Peter Cox, a co-author of the study that appears in the journal, Nature, states, “What we are seeing is that the tropical forests in particular are becoming more vulnerable to warming and we expect this to continue because we expect to see more warming in the future…..the temperature effect caused by increasing CO2 concentrations is probably becoming stronger.”
Whereas the ocean is a stable carbon sink for sequestering CO2, land-based carbon sinks are highly variable depending on changing seasons, precipitation and weather. The climate models to date have not taken into account land-based carbon sinks impacted by rising temperatures. And drought appears to be the single greatest outcome of these expected temperature changes from increasing GHGs from human activity.

The mayor of London announced this week a partnership between UK Power Networks, Transport for London and the city’s Islington Council district to supply more than 500 homes in the area with green heat from the London Tube. Currently Islington uses the Bunhill Heat and Power network to supply green heat to 700 homes in Islington. The expansion will use a Northern Line vent to pipe heat into the network to expand the number of homes being supplied.
Recycling the heat from the London Tube will help the City reduce its CO2 emissions by as much as 500 tons annually. Its continued success should lead to additional waste heating systems coming onboard throughout London.
The project is part of a European Union initiative called CELSIUS, a partnership involving five European cities developing district heating and cooling systems. London’s plan is to eventually produce 25% of the City’s power requirements through decentralized generating stations and district heating networks rather than from energy derived from the grid. In the process the City expects to reduce its CO2 emissions by 60%.

Related articles across the web
]]>Another frightening statistic is the estimate of land that we humans tie up to produce all of this uneaten production – 1.4 billion hectares (almost 3.5 billion acres), equal to about 28% of the world’s agricultural lands. Compare that area to Canada (the second largest country in the world) at 1 billion hectares in total land mass and you can see just how big the geographic impact is on total land mass on our planet.
Additional planetary impacts. Wasted food produces greenhouse gases estimated at 3.3 Gigatons of carbon dioxide per year. Only the United States and China produce greater carbon emissions.
Finally all of this wasted production consumes lots of water an increasingly scarce resource. The total volume equals the annual flow of the Volga, Europe’s largest river, about 250 cubic kilometers of freshwater.
With between 800 million and 1 billion humans experiencing hunger on the planet it would seem that one immediate solution would be to reduce the amount of food we waste. It would mean less pressure on land and freshwater usage.
The FAO study breaks down wastage from cereals, pulses (peas, beans, etc.), fruits, vegetables, root crops, meat and dairy, fisheries and aquaculture. The study also compares food wastage to carbon footprint by different regions with industrialized Asia, and South and Southeast Asia leading while North Africa, Western and Central Asia, North America and Oceania contributing the least in both categories.
Common characteristics across all regions include:
The global carbon footprint from food wastage amounts to average of 500 kilograms (1,100 pounds) of carbon dioxide per person with Europe, North America, Oceania and industrial Asia averaging 700 to 900 kilograms (1,540 to 2,160 pounds), while Sub-Saharan Africa produces 180 kilograms (396 pounds).
With agriculture accounting for 92% of human water usage, the FAO study shows that India, China and Pakistan are the biggest consumers in relation to water consumption correlated to food wastage. The biggest wasters of water of course are animals followed by cereals and fruit crops, while starchy roots contribute the smallest footprint.
In terms of regional water use correlated to food wastage North America, West and Central Asia, and South and Southeast Asia share the largest footprint largely because of cereal production. Sub-Saharan Africa on the other hand uses the least. In terms of per capita results the largest freshwater footprint correlated to food wastage belongs to North Africa, and Western and Central Asia.
Comparing regional food wastage and surface water availability gives you an indicator of the ineffectiveness of agricultural performance within a region. When looking at data this way industrial Asia, South and Southeast Asia are least efficient.
Besides the nutritive value lost by food wastage we also must consider the economic impact. The FAO study estimates the cost based on 2009 producer prices at $750 billion U.S. annually. That is equivalent to the gross domestic product of Turkey based on 2011 data.
This FAO study is the first of its kind and should help identify ways to track wastage so that tools and strategies can be developed to mitigate food losses. In correlating carbon footprint and water usage to food wastage the study is providing a means by which countries can institute new agricultural policies to develop sustainable agricultural practices. And finally, although the study attempts to look at food wastage and biodiversity, this appears to be the weakest area of analysis. The authors readily admit they need better tools to address biodiversity and food wastage within the cycles of production, processing, distribution and consumption. The environmental cost of lost natural resources from food wastage have yet to be taken into account.

The headlines I decided to share with you this week include:
Pandas Move Beyond the Face of Conservation to Become an Environmental Asset
It appears that the icon of the World Wildlife Fund has been given new purpose by a discovery in China at the Life Sciences College of Nanjing Agricultural University. Giant Pandas harbor an antibody that displays strong antimicrobial activity against drug-resistant strains of bacteria and fungi. The substance is cathelicidin-AM, an antiimicrobial peptide, a protein produced within the immune system of Pandas. Bacteria exposed to the protein died in less than one hour. The same bacteria when exposed to more commonly used antibiotic agents survived more than six hours. The researchers led by Dr. Xiuwen Yan hope this discovery leads to the production of new medicines and cleaning agents for tackling superbugs.

New Battlefield Medical Aid May Prove a Lifesaver in Emergencies
The Defense Advanced Research Projects Agency or DARPA for short, funds all kinds of military projects. One of the latest is a medical technology that consists of two liquid components that when injected into a wound site form a solid foam to slow internal bleeding. The developer of the technology is Arsenal Medical in Watertown, Massachusetts. Early clinical trials have demonstrated the foam’s ability to stop severe hemorrhaging for up to three hours, increasing post-injury survival from 8% to 72% in battlefield conditions.
The Arsenal Foam system clinical trial results were recently presented at the 2012 American Association for the Surgery of Trauma Annual Meeting. Application of the foam goes well beyond battlefield trauma usage. We should see it applied in emergency medical response and fire and rescue in the near future.

Cow Burps are not Eco-Friendly
When President Ronald Reagan called cattle and trees a greater threat to greenhouse gas production than fossil fuels he was exaggerating but there is no doubt that cows emit tons of methane. And methane is even more potent than CO2 as a greenhouse gas. That’s one of the reasons for the Cow2 pilot project in Quebec where researchers hope to use crushed flaxseed mixed into cattle feed to reduce greenhouse gases. Laval University in Quebec City is the location of the pilot project which is being conducted at 30 dairy farm sites throughout the province. Quebec is home to the largest number of dairy herds in Canada and produces 3 billion liters of milk annually. The pilot project will examine fat samples taken from cows to determine how much methane gas they are emitting. An unintended benefit from added flaxseed – the milk produced will contain more Omega-3, believed to boost cardiovascular health. Similar studies are being conducted in Europe, the U.S. and Brazil.

New Smartphone App Anticipates What You Need and Delivers
A step beyond Siri, Apple Computers’ voice-activated assistant, MindMeld is a product of Expect Labs, located in San Francisco. The app, named after the Vulcan practice of mind melding as seen on the sci-fi adventure, Star Trek, works on iPads currently with plans to roll it out to Android devices and smartphones in the near future. MindMeld listens and analyzes phone conversations between two or more people. It then displays information about the subjects being discussed. Unlike Siri or current search engine technology, MindMeld uses multiple sensory awareness with speech recognition, natural language processing, image processing, semantic analysis and relationship detection in its arsenal of tools, helping it to find meaningful patterns within conversations. Over ten minutes it, therefore, can analyze a discussion and produce and display what it believes is relevant to enhance the interaction. Described by Timothy Tuttle, CEO of Expect Labs, as “contextual, continuous, predictive search,” it is a step up from Siri and a direct competitor to Google Now, which takes voice search commands and anticipates future web searches as it learns smartphone user habits.

Mitsubishi Car Dealer Introduces i-MiEV Deal That’s Hard to Resist
The i-MiEV is an all-electric vehicle (EV). It’s a city car with a driving range of about 100 kilometers (62 miles). It’s top speed is 130 kilometers (81 miles) per hour. And for $2,100 down to cover taxes, title and license, it can be leased for two years at $69 per month from a Mitsubishi dealership in Normal, Illinois. The battery is lithium-ion and comes with an eight-year, 160,000 kilometer (100,000 mile) guarantee. To recharge the i-MiEV choose from a Level 2, 240 volt charger (costs extra), which takes 7 hours to fully recharge, or a Level 1, 120 volt cable (costs a lot less) which plugs into a regular electrical power outlet and takes 22 hours to fully recharge, or the DC quick charge which takes advantage of the i-MiEV’s CHAdeMO connector port producing 80% recharge in 30 minutes. CHAdeMO sites are the beginning of a universal standard infrastructure to support EVs. So if you are near Normal, that’s Normal, Illinois, and you have a hankering to try an EV, it’s hard to beat this deal.

A Postscript
This blog is now featured on The Futurist, the eZine of the World Future Society. That means a lot more of you can be a part of the conversation in 2013. If you are a first-time visitor who found out about us through Facebook, LinkedIn, Twitter, StumbleUpon, Google, Bing or Yahoo, you can subscribe to receive new blog posting notifications in your email. You’ll find the free subscriber registration on the right side of the Techso Mogro home page.
As always thanks for dropping by and please come back often.
– Len Rosen
]]>Bitumen has other names: oil sands, and less flattering, tar sand. The latter two are seen as pejorative terms for what has been an important resource for economic development in Western Canada. Bitumen is a flash point for controversy in Canada pitting Eastern Canadian provinces against those in the West, being cited for an overly inflated valuation of the Canadian dollar, now described by many to be a Petrodollar, another pejorative.
I have written about bitumen in this blog before but for those of you who are coming by for the first time here’s a quick review. Bitumen is oil bound in sandy deposits. It has been mined a variety of ways over the last 60 years. Where oil sands have been near the surface they have been dug up and carted off to processing facilities where the oil gets separated from the sand and the waste water with solvents gets flushed into large settling ponds. One of those ponds attracted migrating ducks a few years ago and when they landed on the surface they soon died.
Deeper bitumen deposits are pumped out of the ground after high-pressure steam with chemical additives is injected into them to make them viscous. This method also uses a lot of local water which when extracted along with the oil contains lots of contaminants.
Bitumen detractors argue that the methods for creating oil from bitumen use such a significant amount of energy that the final product, synthetic crude, provides little net benefit.
And to make matters worse, both methods of mining bitumen contribute to atmospheric greenhouse gases. The Pembina Institute, a Canadian non-profit think tank, reports that if we were to extract all of the proven bitumen reserves considered economically viable at between $90 and $100 per barrel, the carbon emissions generated would equal 64 tons of greenhouse gas per person in Canada and the United States. That would be equal to 75% of our carbon budget for the next five centuries.
If We Can’t Kick the Oil Habit We Have to Make the Industry Less Polluting
Modern industrial societies have yet to find an energy alternative as reliable as fossil fuels. Hence the search for clean coal technology and less polluting ways to extract and process bitumen. The oil companies and governments are not burying their heads in the proverbial sand, in this case oil sands. Instead government and industry are collaborating to find better technology that lowers the carbon footprint as we make the transition from fossil fuels to reliable renewable energy sources.
A new bitumen extraction technology is being tested by a consortium of companies with funding assistance from the Alberta government. The goal is to reduce the carbon footprint and water requirements in bitumen production. The project is called ESEIEH, meaning Enhanced Solvent Extraction Incorporating Electromagnetic Heating. Four companies, Harris Corporation from Melbourne, Florida, Laricina Energy Ltd. and Nexen Inc., both of Calgary, Alberta, and Suncor Energy Inc., Canada’s premier developer of bitumen extraction technology, have successfully tested an injection technology that replaces steam with electromagnetic heating to extract bitumen from underground (see the diagram below).
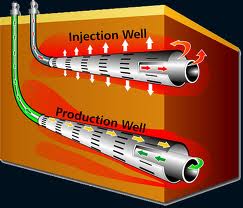
Bitumen extracted using ESEIEH provides a number of benefits including:
The electromagnetic heating technology has been pioneered by Harris Corporation and originally tested in 2011 in Florida. The proof-of-concept test in 2012 was conducted in Northern Alberta in field conditions. An expanded test is scheduled for 2013 before ESEIEH becomes commercially available.
]]>


