Solar panels allow you to be eco-friendly and save on utility bills. The recent Inflation Reduction Act’s passing in the United States is expected to cause a spike in solar panel sales that currently are already receiving rebates and credits from suppliers. But some places on the planet may be more prone to natural disasters, especially coastal and high-wind areas. That’s why solar system owners need to know before installation how well the panels they are buying can withstand natural disasters. Are some more durable than others?
Climate change is leading to increasing severe weather events. Rain can cause floods. And above the ground thunderstorms, lightning and hurricanes can wreak havoc on infrastructure. Solar panel technology, however, is proving to be more resilient than in the past because of technologies like micro-inverters placed under rooftop solar panels to optimize their power. This allows homes affected by a natural disaster to operate without battery backup during the day.
Solar panels are waterproof, meaning they can continue to generate electricity even when soaked, feeding generators to prevent blackouts. Their ability to create power from indirect sunlight allows them to work even in cloudy conditions. And rainfall can help remove debris like pollen and dirt on panels to improve their energy conversion efficiency.
However, there are a few considerations related to solar in the face of floods. First, most solar panel wiring systems, like inverters and breaker boxes, are placed close to ground level which means it is important to protect these fixtures from inundation and add flood assistance and prevention technologies.
In non-roof installations, solar panels on the ground can be uprooted if not properly anchored. If you live on flood plain consider the following:
Despite the metal used in solar panels, they don’t increase the risk of any home being prone to a lightning strike. Lightning isn’t actually attracted to metal, and solar panels are usually constructed from glass and aluminum (the latter is s non-magnetic metal).
Monocrystalline and polycrystalline panels are certified to withstand up to one inch of hail falling at speeds of up to 80 kilometres (50 miles) per hour. In 2017, when Denver suffered from a hailstorm that dropped stones the size of golf balls, it provided an opportunity to analyze the strength of over 3,100 solar panels in the area. Only one installation was affected despite cars and buildings receiving extensive damage. So for the most part solar panels are built strong enough to take a beating.
Snow and ice are of greater concern because when they blanket panels they are unable to generate electricity. Fortunately, Brushing and scraping are the answer to get the panels working again. An interesting fact is that solar panels can perform just as well, if not even better, in snowier environments. And recent advancements have improved the ability of panels to shed ice and snow with coatings of oils, PVC and PDMS plastic.
The biggest safety concern in extreme snow conditions would be the weight-bearing ability of the panels. That’s why manufacturers test the load-bearing strength of their solar panels.
Wind gusts can sneak into the space between your roof and the installed solar panels creating an uplift. With proper installation this is preventable. The likelihood of panel loss would be in extreme wind conditions such as a Category 5 hurricane where gusts would exceed 225 kilometres (140 miles) per hour. Under such conditions, your roof is more likely to blow off along with the solar panels. Most tornadoes never exceed these windspeeds although the highest recorded within a funnel cloud exceeded 480 kilometres (300 miles) per hour.
Solar companies and installers recognize the need to make their panels even more robust in regions prone to natural disasters. Heterojunction solar cell technology (HJT) combines monocrystalline with a thin film to withstand high winds and work well in low-light conditions. These types of panels became more popular after significant storms like Hurricane Maria. The State of Florida requires solar companies to guarantee that their installations can withstand above-average wind gusts up to 274 kilometres (170 miles) per hour.
Another concern about high wind events is that they can cause sandstorms and haboobs. But as long as the wind speeds don’t exceed the upper limits, the only consequence for solar panels is the debris that will land on their surfaces reducing their conversion efficiency.
California is prone to earthquakes. California homes, therefore, are susceptible to the kind of damage earth-shaking events can do. That means their rooftop solar arrays are equally susceptible. Obviously, extra precaution by solar installers is needed there and the state doesn’t allow for solar installations to be constructed directly over areas on seismic faults. Japan, which is also in an earthquake zone is promoting innovative monocrystalline foldable panels with disaster prevention in mind.
Wildfires produce ash which acts very much like the blown sand we described earlier that can accompany windstorms in dry areas. Ash decreases solar irradiance as does the smoke from wildfires reducing solar panel efficiency. Panels can also catch fire. Panels are fire-rated based on superstrate material and frame type. So if you live in an area where wildfires happen and want to install rooftop solar, talk to your contractor about which panels would be best.

With climate change and the pursuit of renewable energy, improving solar panel efficiency is a high global priority. When Hurricane Sandy struck Long Island, the Jersey Shore and New York City, entire neighbourhoods lost power for days. Among the first emergency energy technology deployed was portable solar panels (see the above picture). Solar panels are for many remote places a viable energy source replacing diesel generators that require the transportation of increasingly expensive fossil fuels and that put carbon into the atmosphere.
And in the very near future, we may even see wearable perovskite solar panels that can be applied to clothing, tent walls, curtains and almost any other surface as a first-response energy solution.
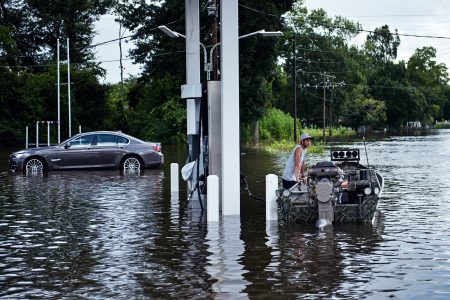
]]>The people of southern Louisiana can’t seem to catch a break. The rising waters in the lower Mississippi River basin have covered roads, breached levees, killed 13 people, and inundated more than 60,000 homes. Described as a once-in-500 year rainfall, it is the eighth time this year that the United States has been on the receiving end of such a weather event. The reinsurance industry right now is probably recalculating probabilities on what the future holds. If I were living in Louisiana and paying flood insurance I wouldn’t want to see what next year’s premium will cost.
The problem with Louisiana is simple. The lower Mississippi River basin is sinking. People have built their communities on a flood plain. And flood risk is spreading. When the waters subside Louisiana’s citizens will return to their ruined homes and rebuild. Hopefully they will be smart to build their houses on stilts or move and build away from flood prone lowlands. If not then they will find themselves paying significantly higher premiums to cover potential 500-year floods that may occur several times in the next decade.
But more insidious is what the floods may bring in addition to water-damaged homes and loss of livelihood. American health officials see the Louisiana floods as a disease threat with Zika, Dengue and other mosquito-borne viruses spreading across the Gulf of Mexico lowlands. Zika, despite significant efforts to knock down the mosquito population through controlled aerial spraying, has already spread beyond initial containment in one Miami neighbourhood. The virus is more than likely to extend its infectious range with all the standing water now available to its host mosquito from the once in 500 year storm.
In the past Zika and Dengue were endemic to tropical and subtropical areas of the world. But the definition of what is tropical and subtropical is changing as global warming moves the latitude line limits away from the equator and closer to the poles. The result states Dr. Anthony Fauci, Director of the Allergy and Infectious Diseases Unit of the National Institute of Health, “It would not be surprising we would see additional cases perhaps in other Gulf Coast states…..There’s going to be a lot of problems getting rid of standing water.” Aedes aegypti, the Zika spreading mosquito, likes standing water and is active during daylight hours. So as people clean up after the flood they need to be cognizant of the potential threat to their health and protect themselves by covering up or using DEET or other mosquito repellents.
Zika in Brazil has been linked to microcephaly in newborn babies born to infected mothers. A Zika-infected person can transmit the virus to a sex partner. Zika is also linked to Guillain-Barre Syndrome, a neurological disease that causes temporary paralysis in infected adults.
May in Toronto was one of the driest on record until yesterday when we almost made up the volume to equate with an average month, most of it falling in one day. This continues to be the new normal in Toronto where we experienced a deep freeze in February and a very late spring, a frost in late May that killed some of my flowering potted plants and a good percentage of the wine grapes in the Niagara Peninsula just to the south of the city.
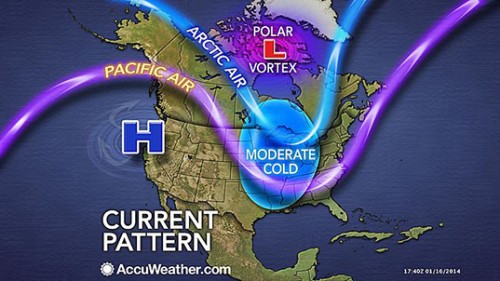
How does the pattern of the Jet Stream relate to weather extremes in North America?
In our data keeping on the Jet Stream the pattern of the last decade is decidedly different from the past. The occurrence of a pattern of upper atmospheric air movement that curls and dips into the mid and semi-tropical latitudes is pulling lower atmospheric air from polar regions driving it south. This languid oscillating movement is pushing warm dry air into the Pacific Northwest and drying out much of the United States Southwest in the process.
Climatologists believe increasing Arctic sea ice melt and with it the longer exposure of open water to the atmosphere and solar heating is playing a part in altering high atmospheric wind patterns. Arctic summers are getting warmer faster than any other place on the planet. If the jump in mean temperatures at mid-latitudes is 1 degree Celsius (1.8 Fahrenheit), its counterpart in the Arctic is closer to 4 to 5 degrees Celsius (7 to 9 Fahrenheit). That warming means weather patterns over the Arctic are being altered.
At the same time we have the oscillations of El Nino and La Nina events in the mid-Pacific with winds driving the air above the warming ocean into western North America, and counter winds driving warmer ocean water into the Indian Ocean with some implications for weather in that part of the world. We’ll get to that in a minute.
So Toronto isn’t alone in experiencing “extreme,” the new normal.
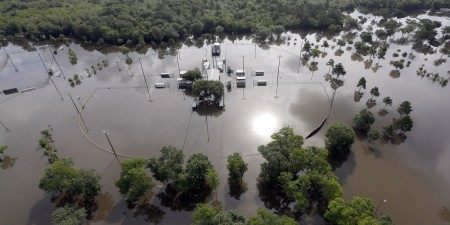
Look at the headlines of the last couple of weeks. A decade long drought in Texas and Oklahoma comes to an abrupt end when historic high rainfalls inundate these states causing massive floods, leaving thousands homeless and killing dozens.
In California climatologists describe the drought crisis in terms that begin with the prefix “mega.” One scientist recently described the situation as no longer being “up a creek without a paddle” but instead “we’re losing the creek too.”
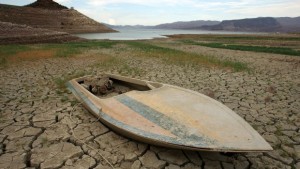
In Northern Alberta, where forests have been devastated by Mountain Pine Beetle, now surviving warmer Canadian winters to reproduce twice a year, tinder-dry conditions combined with unprecedented warm and dry weather have led to a devastating outbreak of 63 wildfires isolating communities, causing evacuations and halting 10% of all oil sands production in the province. The wildfires with no vegetation to hold the mountainsides contribute to mudslides when the occasional rain falls.
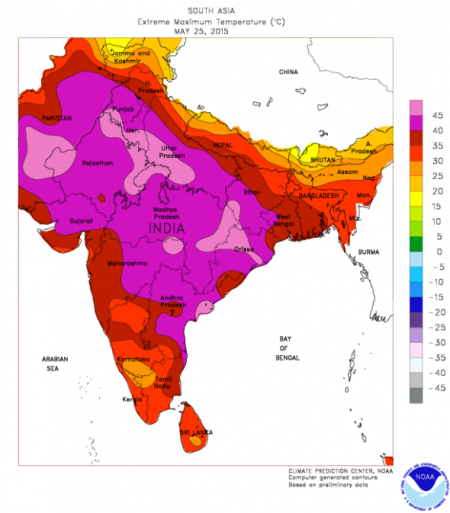
And in India, the May heat that normally precedes the onset of the annual monsoon turns deadly with daytime temperatures approaching 50 degrees Celsius (122 Fahrenheit) leading to more than 2,000 extreme heat deaths. Indian climatologists describe 2014 as the hottest year on record and predict heat stress will continue to grow through the mid-century further exacerbated by rural to urban migration where the urban heat island effect will make things even more extreme. Forecast higher temperatures in the 2020s – 50+ Celsius and by 2080 – 55 Celsius (131 Fahrenheit).
Is extreme weather attributable to global warming and climate change?
Scientists have been cautious to date in linking the two. They have avoided associating events like Hurricane Sandy and Katrina with global warming. Instead they have argued the likelihood of extreme weather events may go up when oceans get warmer and the air over them gets stirred up.
But now some are throwing caution to the wind making statements that argue that climate change affects all weather and storms. Kevin Trenberth, a climate scientist at the U.S. National Center for Atmospheric Research, in Boulder, Colorado, states that weather and storms “cannot not be affected. The risk of drought and flood is greater, and so are heat waves and wildfires. There is excellent evidence for all of these things happening.”
In the most recent research papers on climate some scientists are attributing 75% of the world’s hottest days and 18% of precipitation extremes to climate change. In an April posting to letters in Nature Climate Change, entitled, Anthropogenic contribution to global occurrence of heavy-precipitation and high-temperature extremes, the authors demonstrate that global warming and observed increases in extreme weather are inextricably linked. They state, “Significant trends in temperature and precipitation extremes over the recent decades have been observed and attributed to human influence. Although none of these extreme events was exclusively anthropogenic in a deterministic sense, climate change has changed their odds, which can be expressed as a change in the fraction of attributable risk.” The percentiles at the beginning of this paragraph are theirs.
The implications for a mid-latitude country like the United States are enormous. With the pattern of demographic change flowing from the northeast to the southwest, the U.S. will be increasingly subjected to extreme heat days and extreme heat deaths as the population continues to age. In a paper published on May 18th of this year in Nature Climate Change, researchers project a four- to sixfold increase in extreme heat exposure in the continental United States by the latter half of the 21st century. They attribute their forecast to climate change and population redistribution.
And if you by now are not convinced that atmospheric warming and extreme weather correlate then consider the following tornado study that looked at multiple-tornado day frequency. It appeared in the August 2014 issue of the journal, Climate Dynamics. Researchers studying tornado occurrences found sufficient evidence to link the occurrence of multiple-tornado event days with atmospheric warming and state, “The bottom line is that the risk of big tornado days featuring densely concentrated tornado outbreaks is on the rise….consistent with numerical modeling studies that project increases in convective energy within the tornado environment.” Convective energy, just another way of saying global warming.
Let’s look at the United States in the next three decades. What destinations will you not be going to in the future because they may no longer be there?
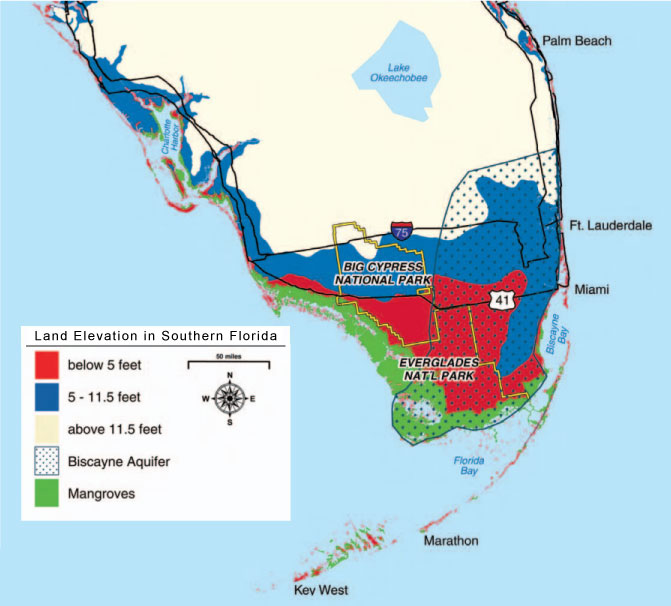
1. Southern Florida and the Everglades – The vacation land of much of eastern North America is becoming and very much will be the first U.S. casualty of climate change. This is not just a question of rising sea levels. The map below has three prominent features: land elevations, location of the predominant aquifer and current mangrove coastal wetlands. Extreme weather events causing storm surges will endanger the beaches off the North Atlantic. There are no mangrove wetlands to assist in protecting shorelines from massive erosion. And beyond those shores stand much of Florida’s prime vacation real estate at elevations under 1.5 meters (5 feet) in areas to the south of Miami. Miami Beach and the barrier keys are all at great risk. But along with the rise in sea levels and the damage of storm surges comes the salt water invasion of the Biscayne Aquifer impacting freshwater resources critical for Florida’s southern cities. Note that Key West may disappear as a destination since it too lies below 1.5 meters elevation.
At current rates of sea level rise in 2014, approximately 3 millimeters (0.118 inches) per year, that translates to a little over one inch per decade. So an increase of one foot is still over a century away. That’s if all things remain the same. But if polar ice melt increases as the century unfolds that date will come much sooner. And every storm that tracks across Southern Florida will imperil the area even further, compromising the aquifer and eroding Florida’s vacation coastline.
2. Central Florida, Cape Canaveral, Orlando, Saint Petersburg, Tampa and Daytona Beach – These areas have no immunity to the changes rising sea levels will bring to the southern part of the peninsula. Much of these areas lie within one meter (39.37 inches) of sea level. Even inland communities like Orlando are at risk from seawater polluting freshwater resources. So visiting the John F. Kennedy Space Center, Disneyworld, Universal City, and Busch Gardens may soon become a memory.
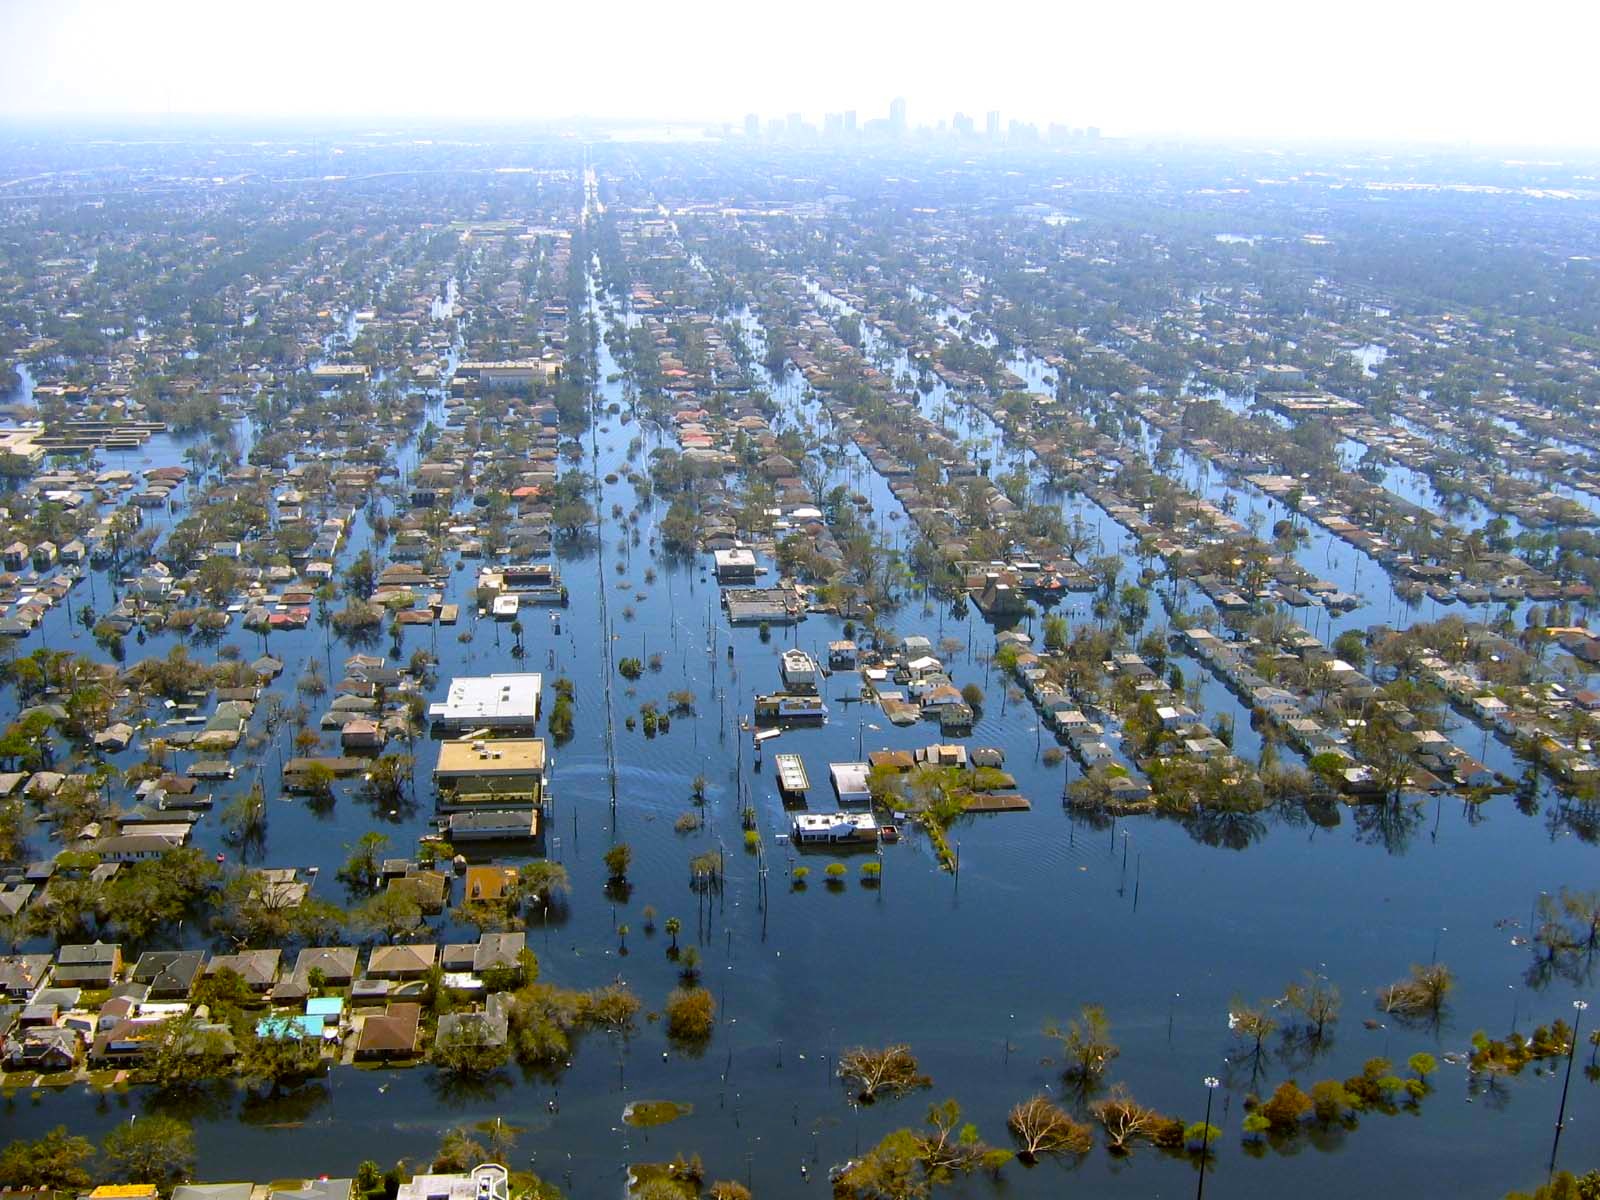
3. New Orleans and Cajun Country – Already a victim many times of extreme weather events including Hurricane Katrina, rising sea levels compounded by the sinking of the Mississippi River delta, denuded of its protective coastal wetlands by human engineered channel digging. Current forecasts indicate that southeastern Louisiana will be under the Gulf of Mexico by the year 2100. The current estimate is a combined rise and subsidence equalling 1.3 meters (4.3 feet). This is a coastline sinking faster than the seas are rising at a rate between 9.24 and 11.2 millimeters (1/3 to 1/2 inch) every decade.
In the draft report issued by the U.S. Global Change Research Program, a federal advisory body, it states that the combination of the sinking delta, thermal expansion of the Gulf of Mexico, and the melting of land and sea-based ice will cause massive innundations here before most other areas in America. So say goodbye to Mardi Gras, the French Quarter and the Garden District of New Orleans along with the bayous and Creole communities of the Mississippi Delta.
4. South and North Carolina, Charleston, Fort Myers, and the Barrier Islands where the Wright Brothers first flew – The last time my wife, daughter and I visited Charleston, South Carolina, it rained and the entire downtown quickly became inundated with almost a third of a meter (1 foot) of water. Apparently this is a common occurrence in this historic and beautiful city. But as sea levels rise it won’t be rainwater that the people of Charleston will have to pump from their basements and city streets. It will be the North Atlantic.
Situated along the storm track of North Atlantic hurricanes, this coastline is subject to extreme weather regularly. But with climate change those storm surges will be that much larger. The barrier islands are most vulnerable. Those bicycle rides on the pristine, flat beaches will be no more. The Museum at Kitty Hawk, North Carolina will be marooned at sea or underwater.
Currently the state governments here are frantically building new seawalls in the hope they can protect shoreline communities until the end of the century. But the seawalls are built behind the beaches.
In a recent article entitled, “South Carolina’s Solution to Sea Level Rise: Build More Walls,” Emily Atkin, the author, states “the state faces an average temperature rise of as much as 9 degrees Fahrenheit [5 Celsius] over the next 70 years. Along with the heat would come increases in wildlife disease, loss of habitat for wild game, degradation of the state’s valuable recreational and commercial fisheries, and – unsurprisingly – sea level rise, saltwater intrusion, and beach flooding.” And South Carolina’s government continues to deny climate change.
5. Washington, DC and Chesapeake Bay – Visits to the American capital and Tidewater Virginia have always been a fun experience for my family. But what happens to this part of America in the next 30, 50, or 70 years? The picture I have described for Southeastern Louisiana holds true for Chesapeake Bay. This is an area of America where the combination of rising sea levels and subsiding coastal areas will result in much larger changes. One contributing factor to the sinking of the Chesapeake region is the rise in population and drawing of freshwater from underground aquifers. This is putting much of the Delmarva Peninsula and the Virginia Coastal Plain at risk. Subsidence in some areas is being measured at rates as high as 4.8 millimeters (almost 2/10s of an inch) per year. Loss of coastal wetlands is further contributing to the disappearance of coastline.
For the American capital the threat of climate change is expected to impact freshwater supply with climate models projecting by 2040 a 35% decline in the Potomac as a water source. Washington, like the Carolinas will see much higher mean temperatures. And if I can remember from past visits to the nation’s capital in the summer, the place is already so hot and steamy you could fry and egg on the pavement in the noonday Sun. What will an additional average rise of 5 Celsius (9 Fahrenheit) degrees do to those planning a visit?
6. New York City, the Statue of Liberty, Ellis Island and the beaches of Long Island – New York and Long Island have been a destination for me in both my work and leisure life. I spent a number of years working for companies with headquarters here and have driven the length of Long Island all the way to the Montauk Lighthouse at the very eastern tip. So in looking at climate change and what it will do to this part of the U.S. east coast I want to cry.
In November of 2012 I wrote about the plan for New York and Long Island and what it will take to survive extreme weather event like Sandy combined with rising sea levels. New York has been tracking sea level rises for over a century. In 2012 after Sandy the city took action with a plan to harden its infrastructure looking at 900 kilometers (520 miles) of coastline most vulnerable to storm surges. The City has plans to protect its most critical infrastructure components from subways to the power grid and freshwater resources. It has proposed flood gates strategically located to control flooding. Inventors have come up with inflatable plugs to block seawater from flooding the subway system. Buildings are being retrofitted with renewable and standalone power systems should the grid fail.
But as good as these plans are New York City won’t be able to save the Montauk Lighthouse, and probably Liberty Island and its famous statue, or Ellis Island where so many Americans first landed as new immigrants.
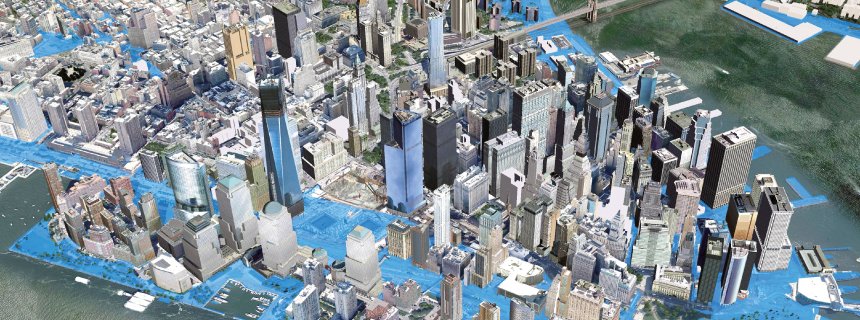
I have limited the posting today to just those areas along the eastern seaboard of the U.S. that will be most impacted by the climate change happening now and over the coming decades. Climate change from the carbon already pumped into the atmosphere will be with us for a number of centuries. Most of us won’t experience its worst impacts in our lifetime. But our children’s children will.
What we will experience if we live to mid-century will be unsettling but manageable. What our descendants will experience by 2100 will be downright uncomfortable. And beyond 2100 so much of what I have described above will be experiences our descendants will do virtually, or will read about in e-literature. Their tours will show what Disneyworld was like and where the first Americans were launched into orbit. They will visit a virtual display of an anti-bellum Charleston or the French Quarter and Garden Districts of quaint and beautiful New Orleans.
Why? Because these places will have ceased to exist.
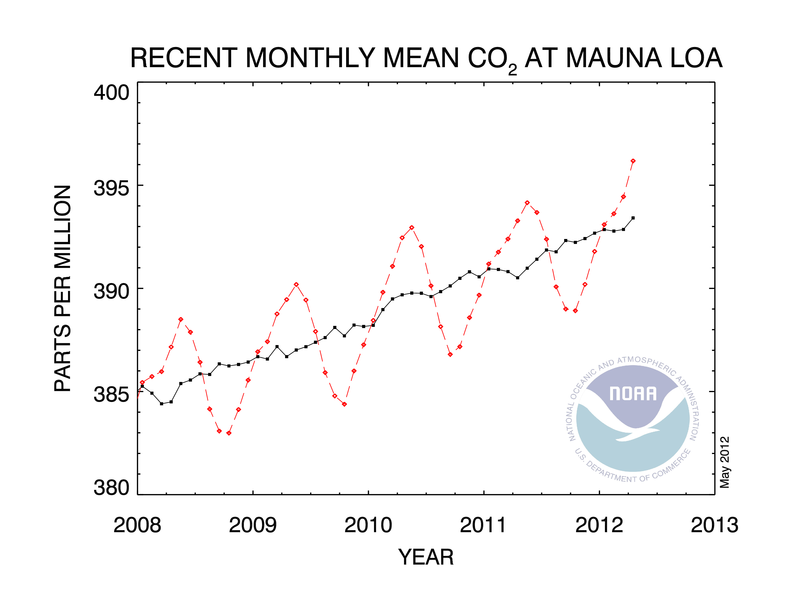
]]>It has been 800,000 years, based on geological records, since the Earth has seen CO2 levels this high. Readings in Alaska, Greenland, Norway, Iceland and Mongolia this spring have all reached or exceeded the 400 PPM plateau.
Following the year of no winter in most of North America, and a record 12 extreme weather events causing more than $1 billion U.S. in damages, we have witnessed temperature extremes, drought and severe weather on a unprecedented scale.