Utilities today are more vulnerable to weather extremes than in the past. Why?
Utilities have to put their assets in place to service these homes and when the latter are at risk so is the infrastructure that the power companies erect. The best recent example of utility risk is the wildfire that engulfed Paradise, California, a fire purportedly started by weather that caused powerlines to fall igniting the dry forests near the community. PG&E sought bankruptcy protection after the smoke cleared. The utility faced $7 billion in claims and filed for bankruptcy in January of this year.
Power plants tend to be more vulnerable than most industrial facilities because they are built near water sources. Hence 44 were flooded when Hurricane Irene made landfall in August of 2011, and 69 met the same fate with Hurricane Sandy in 2012.
Hurricane Harvey in 2017 saw 6,200 poles, 850 transmission structures, and 21.4 gigawatts of power impacted by wind and flooding.
In 2005 when Hurricane Katrina struck, Entergy, the Louisiana-based utility was forced into bankruptcy protection from the significant damage to the city of New Orleans. The utility lost more than 75% of its transmission lines and sub-stations. Since Katrina, Entergy has invested $1 billion on hardening its transmission and distribution infrastructure to withstand a Katrina-level storm. And now it is investing in restoring Louisiana’s coastal wetlands to stave off storm surges and coastal flooding.
ConEd, the utility most impacted by Hurricane Sandy, has also spent $1 billion to strengthen its infrastructure raising equipment in flood zones, and isolating parts of the grid to ensure continuity of service can be maintained in the event of another storm of equal magnitude.
Florida Power & Light has also been hardening its infrastructure since Hurricane Wilma in 2005 made landfall in the state. More than $3 billion has been invested so far in flood protection, the burying of powerlines, and replacing wooden poles with steel and concrete. Nonetheless, despite these efforts when Hurricane Irma landed in 2017, the utility’s best efforts weren’t robust enough with more than $1 billion in damages to its post-Wilma improved infrastructure.
These are but a few examples of what has been experienced in the past 20 years, and from the latest forecasts foreshadowing a more dire future for utility operators. And the forecast of increased damage and lost revenue doesn’t take into consideration the negative impacts of increased atmospheric temperatures with more heat waves, more polar vortices, and sea-level rise not associated with storm surges.
But hardening traditional infrastructure may be a fool’s errand. Instead the McKinsey Report suggests utilities build resilience in other ways including:
And governments both local, state and national, can help by restricting development in areas deemed to be more at extreme climate risk. That means you don’t rebuild a Paradise, California. And you don’t put homes and buildings on floodplains and along coastlines that have experienced storms like Hurricane Sandy and Harvey.

Hurricanes Aren’t the Only Weather Phenomena Approaching Extremes
If you look at weather maps today in places like Australia and India you’ll note a new isotherm (the line that marks the delineator between different ranges of temperature).
Australia in the last few years added a 50 Celsius (122 Fahrenheit) isotherm. That’s because the interior of the continent has seen temperatures exceed that amount for extended periods for the first time in recorded history.
India, Iran, Pakistan, Saudi Arabia, the United Arab Emirates and other countries spanning the tropics or desert zones of the planet are also adding a 50 Celsius isotherm.
A friend of mine visiting Greece this summer told me that temperatures regularly exceeded 40 Celsius. Greece wasn’t alone. Much of Southern Europe and the Mediterranean littoral experienced unprecedented heat waves.
So those people who chart the weather on maps are having to add a new upper scale when dealing with temperature.
It’s Happening with Hurricanes Too
Hurricanes appear to be getting more intense. The prevailing science states that these storms when moving over large swaths of warm ocean water can intensify dramatically in a very short period of time. That’s what we witnessed with Harvey, a storm that jumped from a Category 3 to 5 in a very short period of time.
If you are unfamiliar with the current Saffir-Simpson classification scheme for these monster storms, it is as follows:
| Category | Wind speed | Damage |
|---|---|---|
| 1 | 119 to 153 kms. or 74 to 95 miles per hour | Winds produce some damage. Well-constructed frame homes have damage to roof, shingles, vinyl siding and gutters. Large branches of trees snap and shallowly rooted trees may be toppled. Extensive damage to power lines and poles likely result in power outages lasting one or more days. |
| 2 | 154 to 177 kms. or 96 to 110 miles per hour | Winds cause extensive damage: Well-constructed frame homes sustain major roof and siding damage. Many shallowly rooted trees are snapped or uprooted and block numerous roads. Near-total power loss occurs with outages that last from several days to weeks. |
| 3 | 178 to 208 kms. or 111 to 129 miles per hour | Devastating damage occurs: Well-constructed frame homes incur major damage including removal of roof decking and gable ends. Many trees are snapped or uprooted, blocking numerous roads. Electricity and water become unavailable for several days to weeks. |
| 4 | 209 to 251 kms. or 130 to 156 miles per hour | Catastrophic damage occurs: Well-constructed frame homes sustain severe damage with loss of most of the roof structure and exterior walls. Most trees are snapped or uprooted and power poles are downed. Fallen trees and power lines isolate residential areas. Power outages last weeks to possibly months. Most of the area impacted becomes uninhabitable for weeks to months. |
| 5 | 252 kilometers or 157 miles plus per hour | Catastrophic damage occurs: A high percentage of homes are destroyed, with total roof failure and wall collapse. Fallen trees and power poles \isolate residential areas. Power outages last for weeks to months. Most areas remain uninhabitable for weeks to months. |
Note that the Saffir-Simpson scale doesn’t account for coastal storm surges, rainfall, and flooding. Harvey’s winds may have hit a Category 5 just before landfall but the real damage from it appears to be the coastal storm surge and the enormous amount of precipitation unleashed leading to extensive lowland flooding.
Harvey’s winds may have briefly hit Category 5 just before landfall but the real damage from it appears to be the storm surge and the subsequent enormous amounts of precipitation unleashed leading to extensive lowland flooding.
Irma is Coming
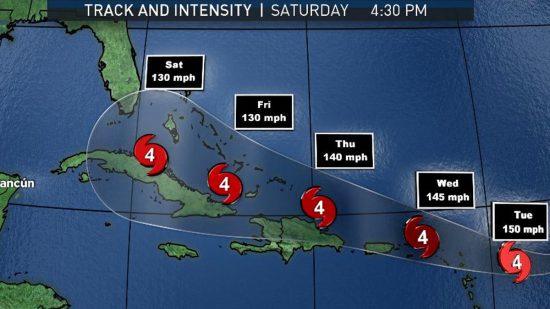
Irma (see the projected track on the map above) is next in the chain of storms this year. Already its winds exceed the low end of Category 5 at 280 kilometers (175 miles) per hour. And Irma isn’t weakening as the storm moves westward towards the Leeward Islands, Bahamas, Puerto Rico, Hispaniola, Cuba, and likely Florida. Eastsern Caribbean sea temperatures are above normal and the warm water is fuel to Irma. It is likely that the hurricane will see wind speeds exceed 300 kilometers (186 miles) per hour. Irma may join a rogues gallery of killer storms. On wind speeds alone the top 5 of all time include:
Irma could end up joining the rogues’ gallery of killer storms. The top 5 all time for wind speed include:
Note Hurricane Katrina doesn’t make it to this list as a Category 3 storm. Yet Katrina was the most devastating hurricane to strike the United States coast before Harvey, displacing millions and killing more than 1,800.
Nor does the Great Hurricane that struck Galveston on September 8, 1900 before storms were given names. Galveston witnessed a storm surge that wiped out the city and killed 12,000.
Nor does the San Felipe-Okeechobee Hurricane of 1928 that struck Palm Beach, Florida and caused a storm surge on inland Lake Okeechobee that killed 1,800.
And then there is Sandy in 20102 which flooded the New Jersey and Long Island coasts as well as Lower Manhattan, bringing New York City to a grinding stop.
So hurricanes aren’t just to be feared for high-speed winds. They hatch all kinds of deadly weather phenomena. And the future prognosis in light of global warming and climate change indicates greater intensity as well as altered tracking behavior. Climatologists point out that Harvey may be a symptom of a new phenomenon. The storm appeared to stop dead after landfall. This behaviour fueled intense rainfall as the storm continued to draw on moisture from the warm Gulf of Mexico. And many climatologists believe that a warming atmosphere will lead to more of these types of fronts blocking the progress of the normal hurricane path, westward followed by a turn to the northeast. Harvey eventually moved northeast but the stalling over the Texas coast and hinterland proved to be utterly devastating.
Mny climatologists studying hurricanes believe that a warming atmosphere will lead to more storms slowing down and deviating from the normal path, westward followed by a turn to the northeast. Harvey eventually followed that pattern but not before a long pause that proved devastating to Houston and coastal Texas.
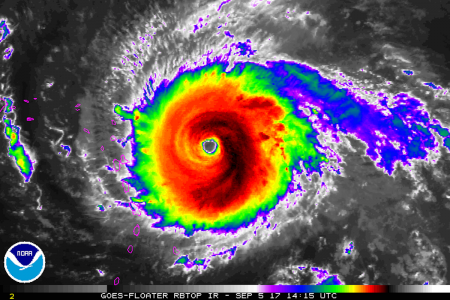
]]>
In a paper entitled, “Using climate model simulations to assess the current climate risk to maize production,” published in Environmental Research Letters, Volume 12, Number 5, Met Office researchers Chris Kent, Edward Pope, Vikki Thompson, Kirsty Lewis, Adam Scaife and Nick Dunstone describe the results of advanced climate modelling focused on maize, a critical crop for global food security.
Based on observed historical data and present day climate analysis that looks at stresses to maize, the researchers applied 1,400 simulations to attempt to quantify the future risk to the two principal maize growing areas of the planet, the United States and China. What the simulations predicted was a potential “multi-breadbasket failure” from “climate-related maize shocks.” They estimated the likelihood of a double whammy to these important maize growing areas as increasing at a rate of 6% per decade based on future climate models and forecasts.
Chris Kent, the lead author of the study, states in an interview. “This is the first time we have been able to quantify the risk. It hasn’t been observed in the last 30 years, but the indications are that it is possible in the current climate….The impact would be felt at a global scale.”
Maize or corn, the name we give it here in North America, is along with rice, wheat, and soybeans, represent the world’s staple crops feeding most of our global population. The United Nations Food and Agriculture Organization estimates that maize, rice, and wheat make up 51% of all the calories consumed by humans on the planet.
The Met Office risk models looked at world production of maize estimated at 1 billion tons in 2014. Of that total, 360 million tons were produced in the United States, and 215 million in China. Extreme weather events impacting either of these two nations or both within a single growing season would be the feared double whammy.

In 2016, Africa was victimized by a major maize crop failure brought on by a drought that impacted 50 million. It marked the second year of a drought that affected crops in Central and East Africa. Malawi, Mozambique, Lesotho, Zimbabwe, Namibia, Madagascar, Angola, Swaziland, Botswana, Kenya, Somalia, Ethiopia, South Sudan and the Democratic Republic of the Congo were all impacted. Nearly 31 million faced near starvation. Imagine if a similar failure happened in China, the United States or both. Instead of 31 million, the impact would be felt by hundreds of millions.
The Met Office models and data showed that such an occurrence is an increasing risk. States Kirsty Lewis, a co-author of the study and Science Manager at the Met Office, “We have found that we are not as resilient as we thought when it comes to crop growing…..We have to understand the risks we face or there is a real danger we could get caught out.” The Met Office is now working cooperatively with researchers in China to better understand that country’s growing climate risks on agricultural production.

]]>
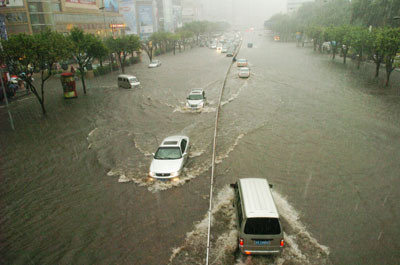
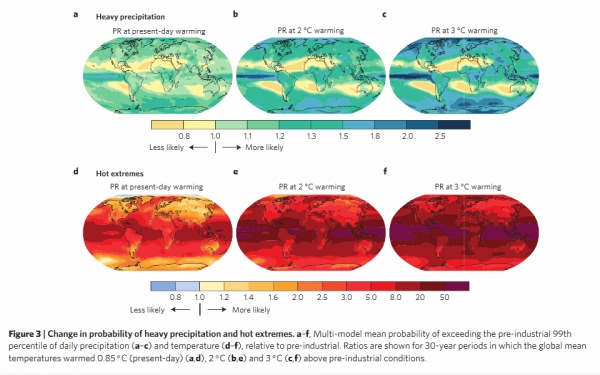
In their study they state that “today 75% of the moderate hot extremes and about 18% of the moderate precipitation extremes occurring worldwide are attributable to warming, of which the dominant part is extremely likely to be anthropogenic.” That means the balance are not causally linked to what we humand are doing to the planet. Think about that. For every four extreme heat events three are anthropogenically derived. And almost one in five extreme weather events can be linked to anthropogenic causes.
The authors link present day warming of 0.85 Celsius (1.53 Fahrenheit) and increasing extreme precipitation events as exceeding pre-industrial occurrences by a small margin. But when they project the trend to a warming of 2 Celsius (3.6 Fahrenheit) the link increases by a 1.5 to 3 times factor depending on location on the planet. Worse in the tropics and in extreme polar locations and weaker in the mid-latitudes.
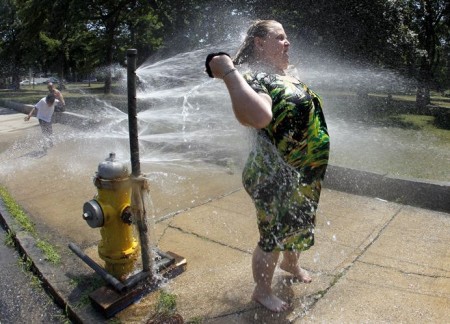
They write, “this implies that on average…an event expected once every 10,000 days (about 30 years), in pre-industrial conditions, is expected every 10 to 20 years at a 2 Celsius warming.” There is a similar correlation with extreme heat events. The authors state, “the trend to more hot extremes with increasing global temperature is ubiquitous. Already at an observed warming of 0.85 Celsius the probabiliyt of 1-in-1,000-day hot extremes over land is about five times higher than in pre-industrial conditions.”
For the “I’m not a scientist” crowd the study states that that quantifying the human contribution to a single weather event is challenging, but when you analyze the massive amount of observational global data you remove the uncertainty. The authors use sophisticated modeling of the data to draw their conclusions and although models aren’t the real world, they are an attempt to simulate it as closely as possible.
It is hard to argue with the wealth of sampling the authors have used to build their hypothesis. Nor can you argue with their motive. They hope policy makers can use this as a tool for mitigation and adaptation decisions. When combined with maps the data can serve to show actual risk and vulnerability. The authors state “the fraction of heavy precipitation and hot extremes attributable to warming is highest over the tropics and many island states, which typically have high vulnerability and low adaptive capacities.”
The maps appearing below come from the study. Areas of greatest vulnerability are highlighted.
What are its conclusions?
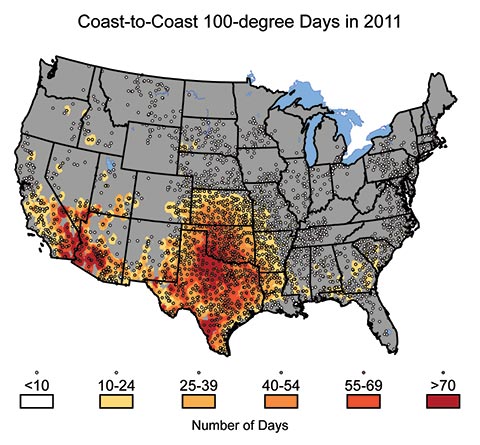
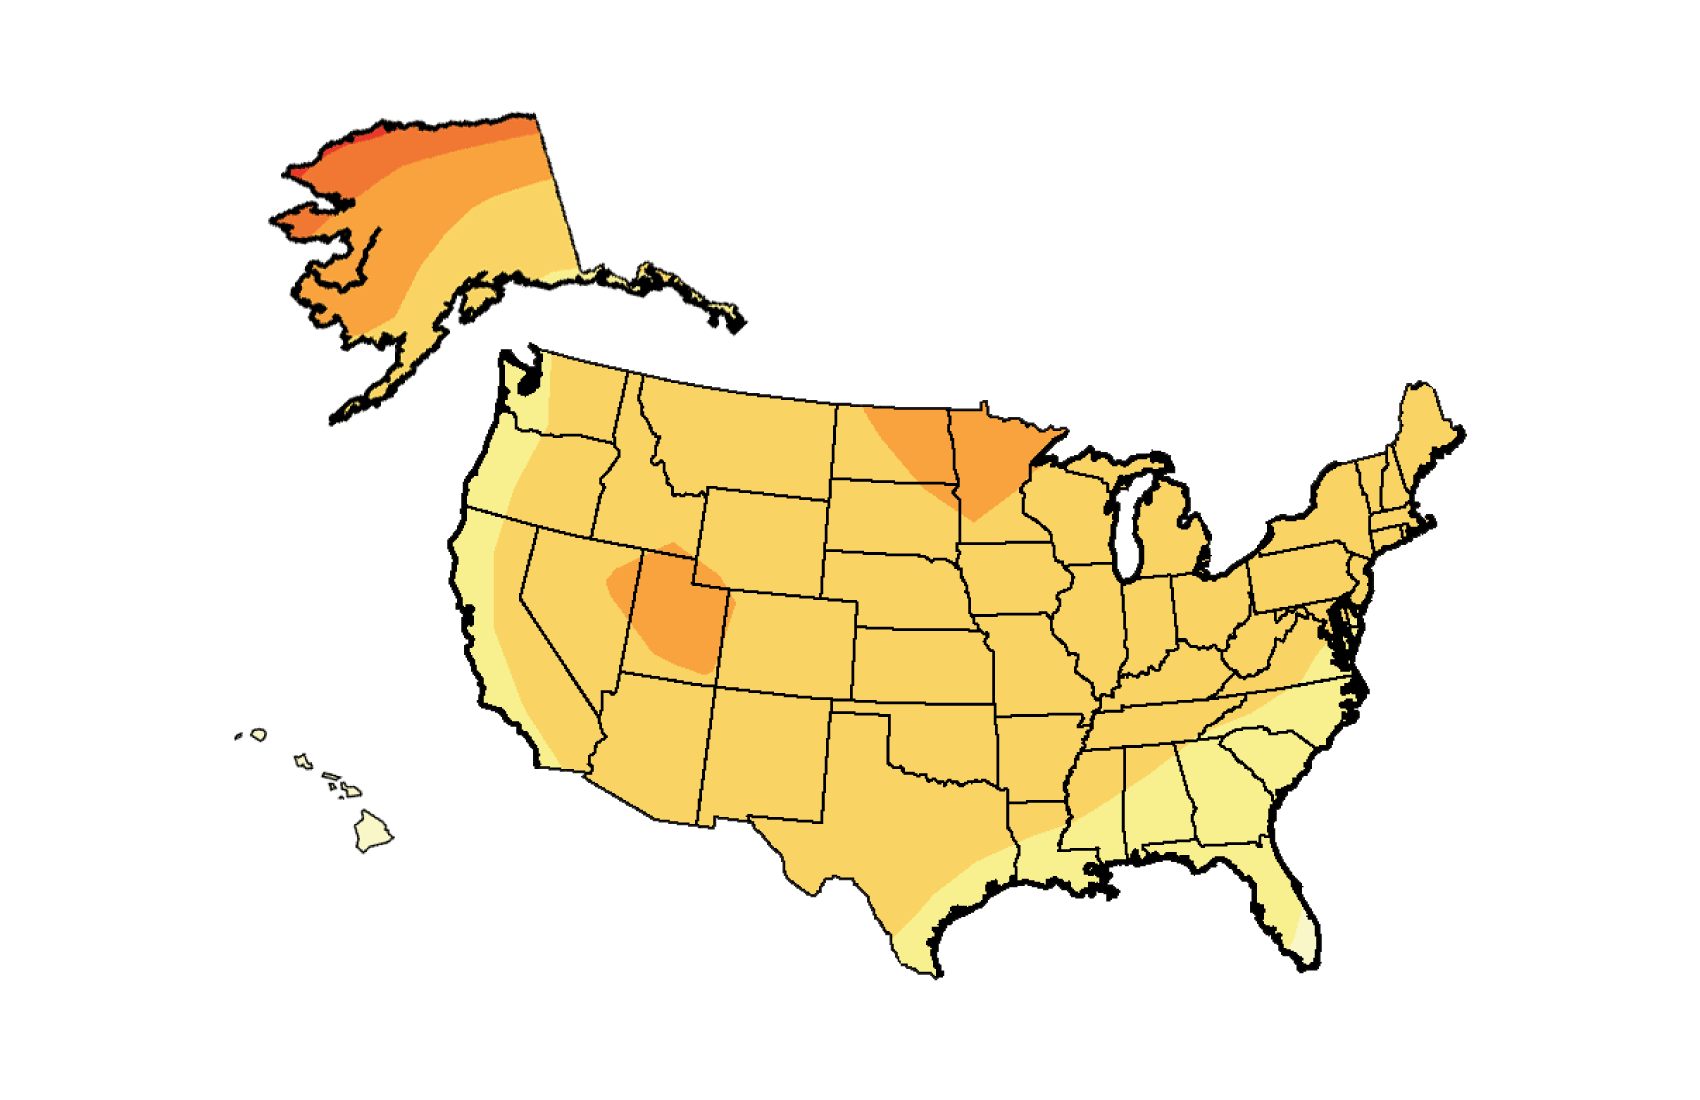
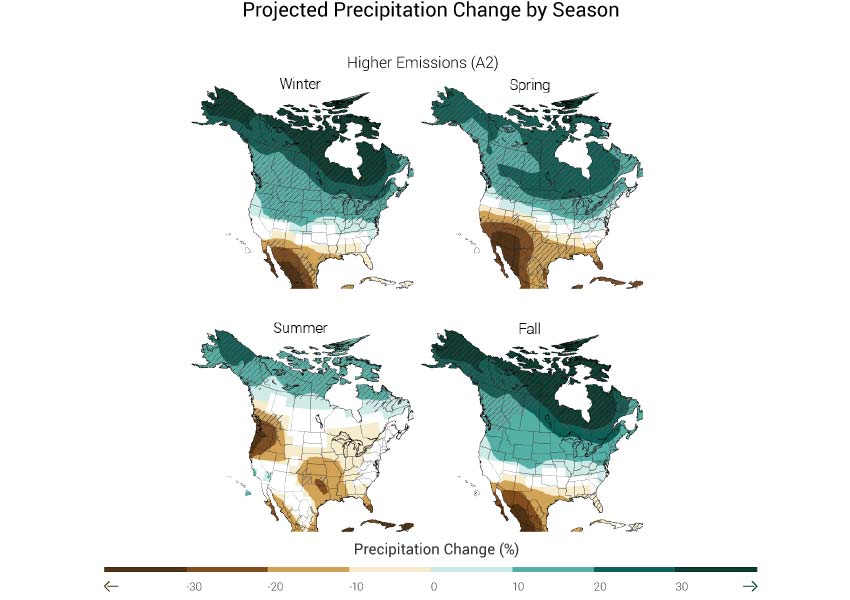
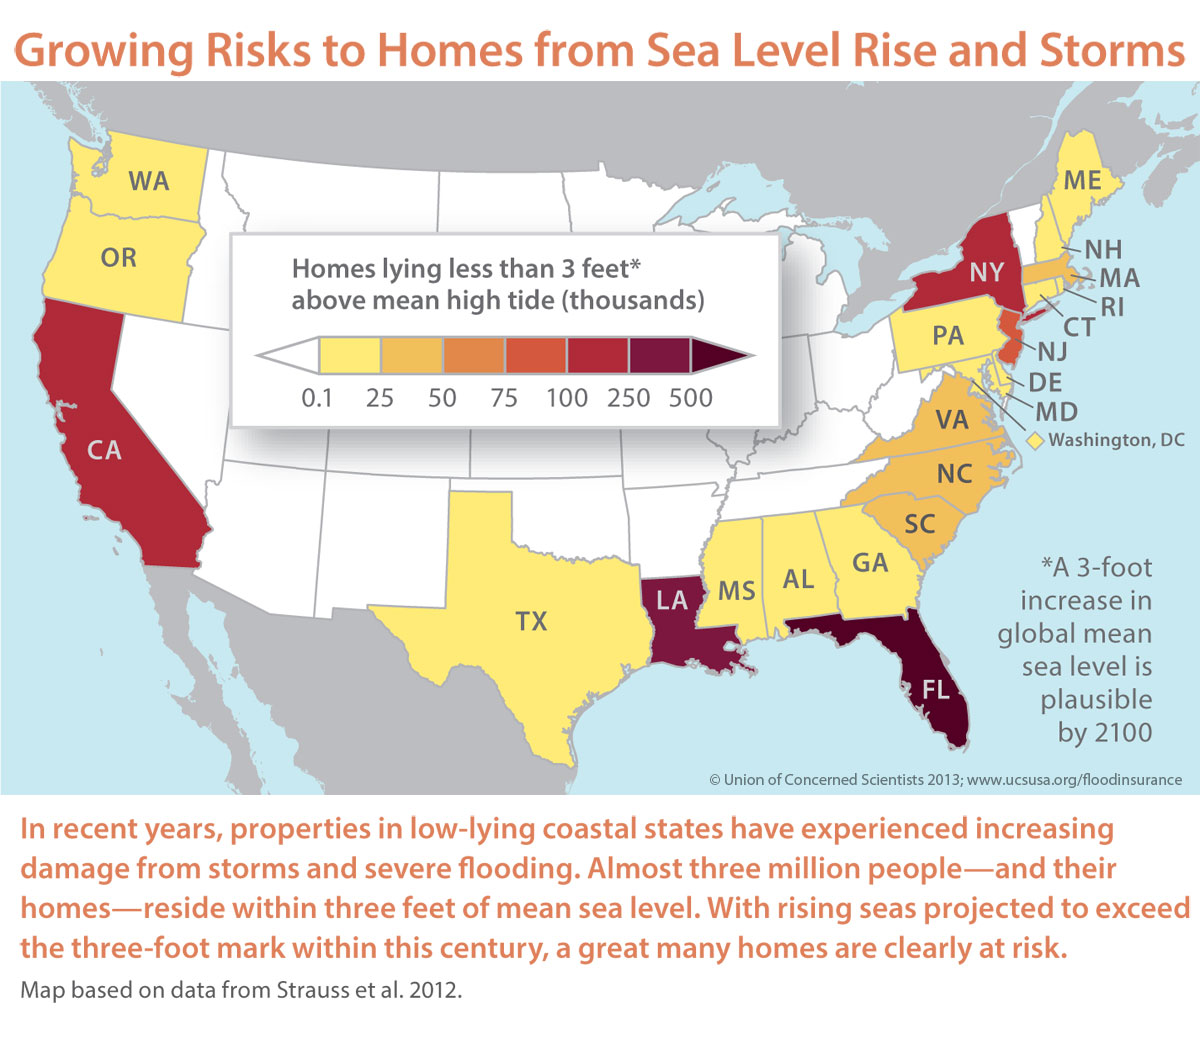
In the end it isn’t just about warmer temperatures, extreme weather events and rising sea levels. It is about how a country’s infrastructure is built to cope with these changes. Storms like Hurricane Katrina and Hurricane Sandy caused massive critical system failures both at the local and national level. We may never see another Katrina or Sandy but based on projections of extreme weather events that is highly unlikely. Our capacity to respond to such devastating storms has shown incapacity and the investment needed to harden infrastructure is just not happening to the extent required. That leaves the country more vulnerable. And there is a further threat that without a hardened infrastructure each extreme weather event will further weaken the country’s ability to respond.
The threat to the agricultural heartland is just as real as storms like Katrina and Sandy. The decadal drought in Texas and California, the dropping water levels in the Colorado River Basin, the drying out of the Ogallala Aquifer, will sharply alter the ability of Mid-West farmers to produce yields of traditional food crops and livestock to meet national demand. Will the drying south and heartland be offset by the rise in precipitation and temperatures in places like the Dakotas, Minnesota and Montana? Will these areas become the new heartland for agriculture on the continent along with the Canadian Prairies to the north? Just look at the maps and place your bets.
And along with rising temperatures in areas of the country that have never experienced them will come the invasion of insect pests along with diseases previously unknown to regions of the country. Malaria, Dengue Fever, Lyme Disease, West Nile Virus, Tularemia, Rocky Mountain Spotted Fever, Chagas Disease, Chikungunya and Rift Valley Fever are just a few among many diseases that will become more threatening as temperatures rise. That’s because the carriers that transport these diseases will find an expanding range in which to thrive.
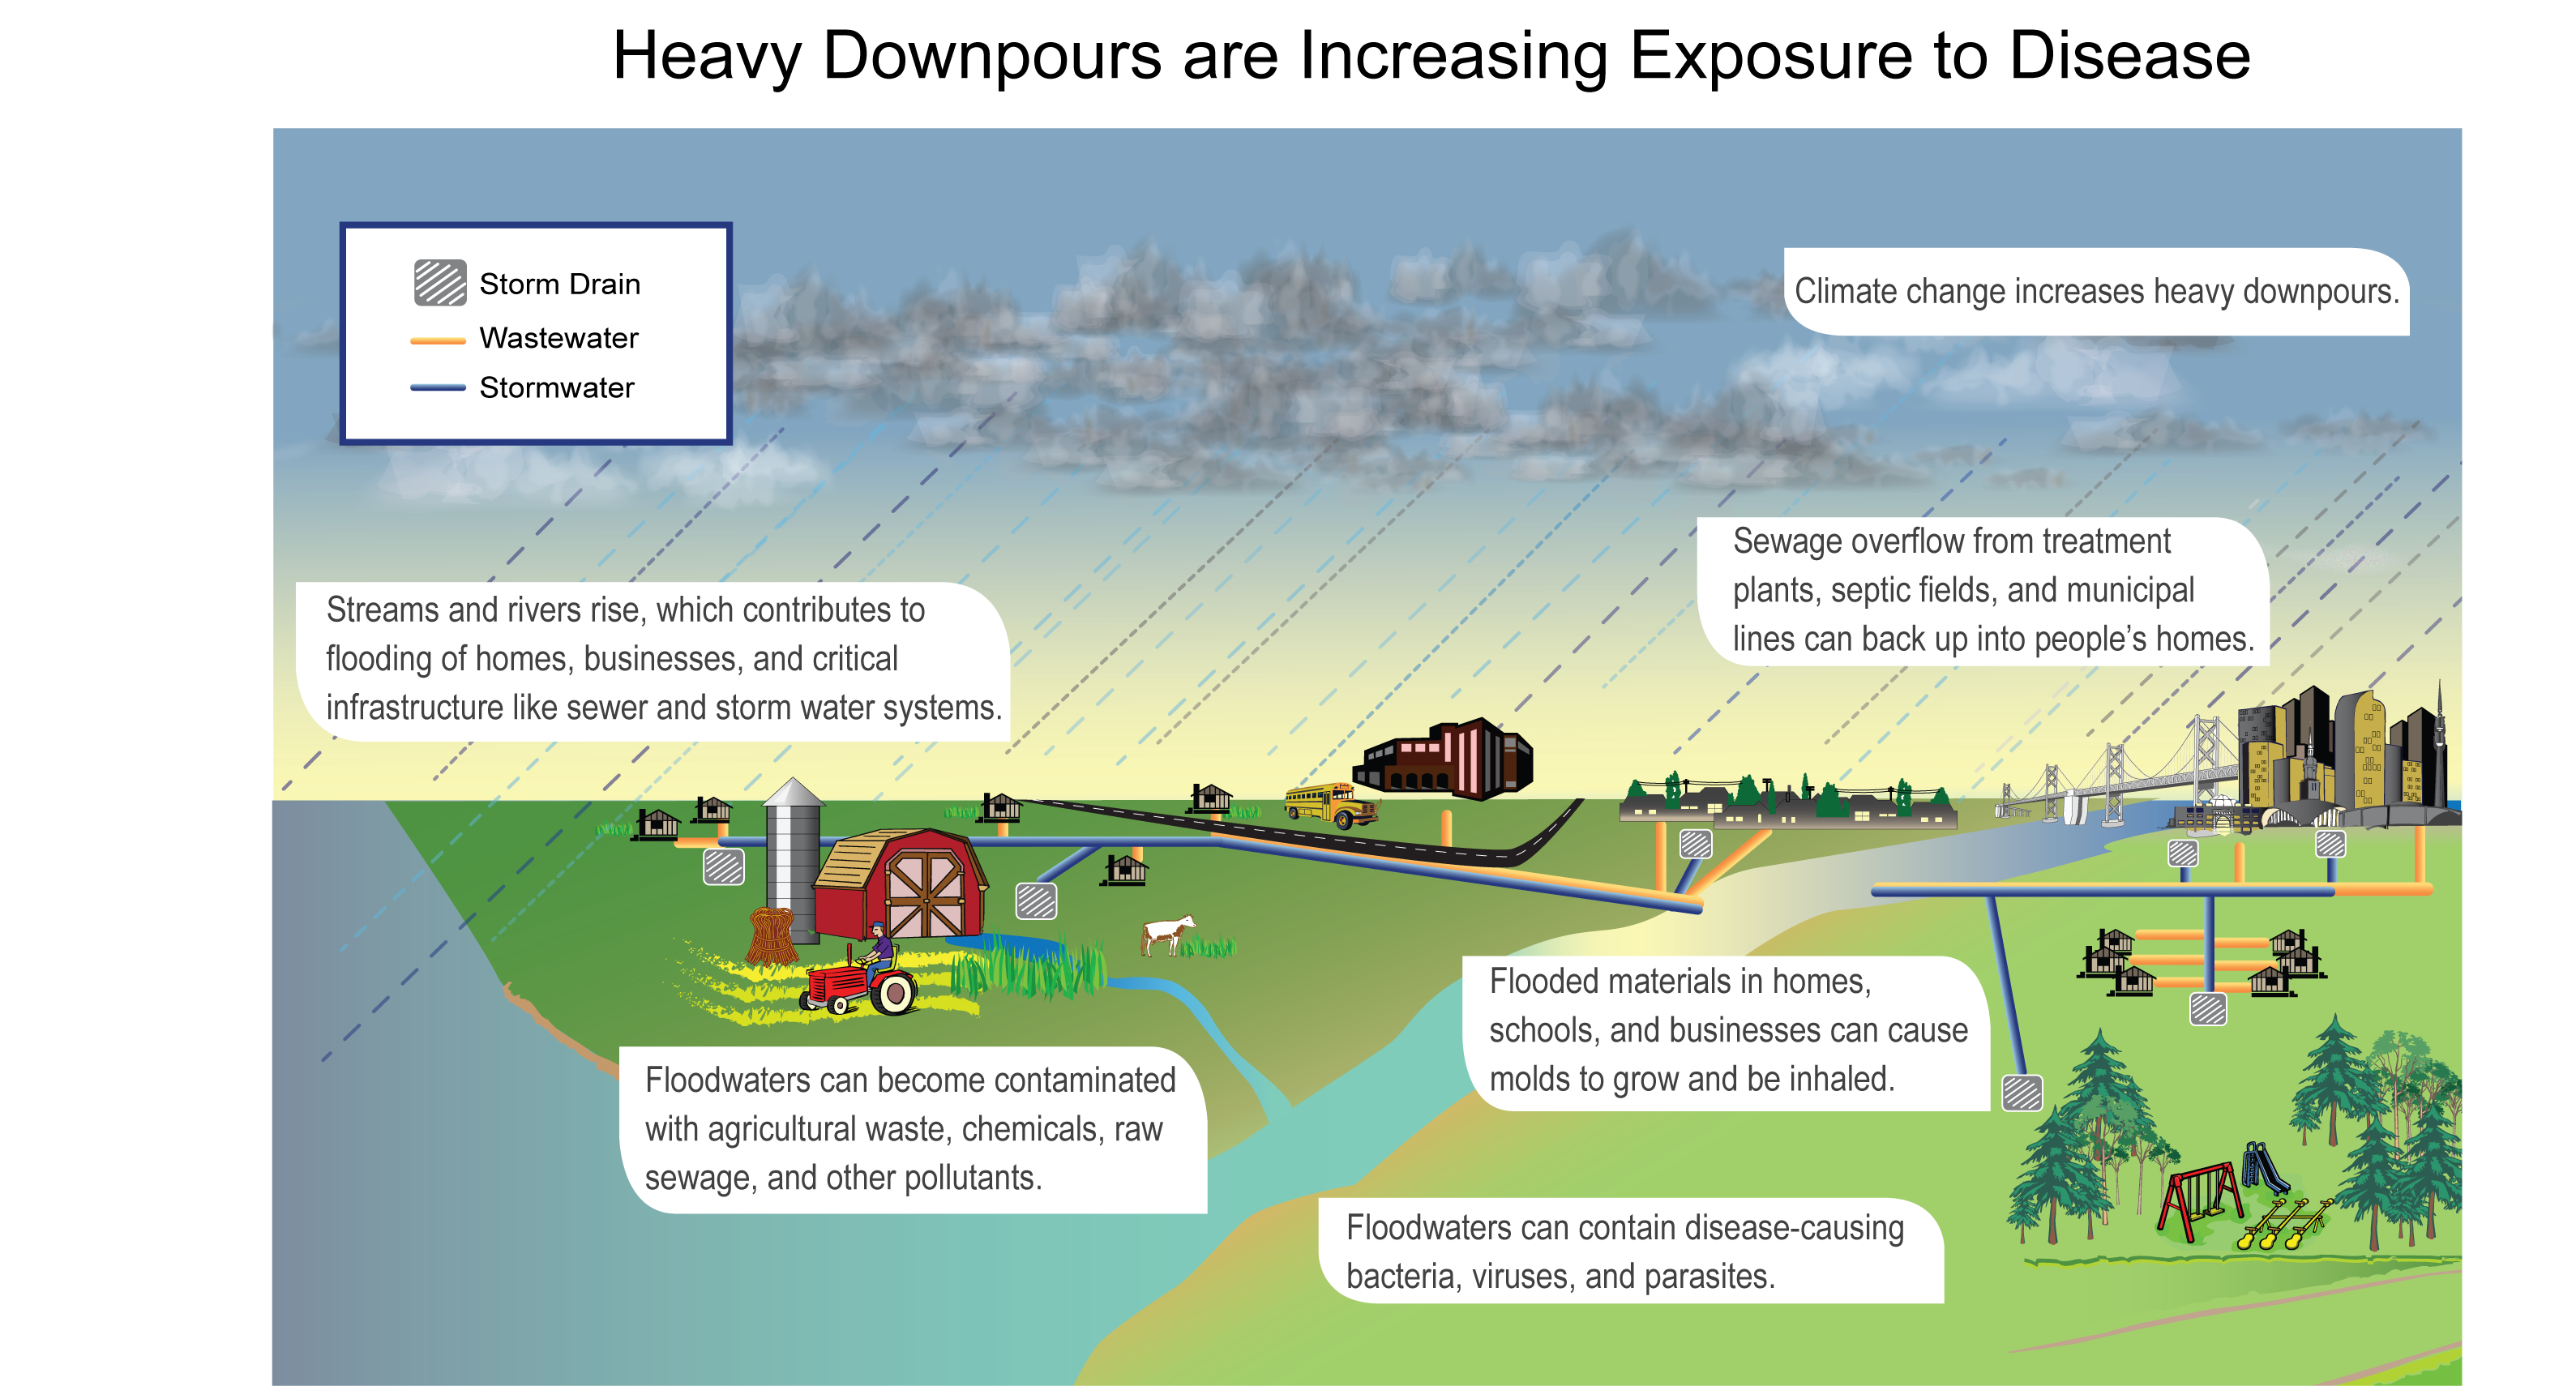
Increased CO2 in the atmosphere is contributing today to increases in allergies. Extreme rainfall is enhancing growing conditions for fungi and molds. We are at risk for higher incidents of asthma and other respiratory conditions. Sudden heavy rains overwhelm septic systems and municipal treatment plants putting us risk for waterborne pathogens and diarrheal illnesses. And those same stream swollen by rains will also contribute to agricultural land loss, soil erosion, spills of chemicals and other pollutants into lakes, rivers and oceans. In the illustration below we see a depiction of how heavy precipitation events increase people’s exposure to risk. The source is NOAA.
For the scientists who have written this report there is no “I told you so” in their descriptions and tone. They recognize that the country needs to adapt to the reality that we are living with climate change in the present and seeing its early impacts. We have two tasks ahead of us. The first is to mitigate the most extreme outcomes of our global dependency on fossil fuels by reducing our use of these greenhouse gas contributors. But that is not enough. The second is to develop adaptation strategies to ensure that we ride out the storm of global climate change in the best possible shape.
There is a price to be paid for all this change brought on by climate. There is a need for a shifting mindset on the part of citizens so that conservation, reduction, renewable and sustainable become the words that march us through the rest of the 21st century. This is what this climate assessment is telling us and if we don’t listen, we do this at our own peril.
The link to the entire report can be found in the opening sentence of this posting. Or you can watch this short video which provides a summary of what has been learned. Whichever you choose you owe it to yourselves to learn more about how climate change will impact you where you live.
]]>
April 18, 2014 – The Toronto-Dominion Bank, currently vying for the number one position in Canada, and a growing player in the United States, issued on April 14 a special report, Natural Catastrophes: A Canadian Economic Perspective. The document doesn’t directly talk about climate change but it is inferred throughout. Instead it talks about “weather conditions” and their socioeconomic impact.
As banks would normally do they look at the financial implication of more extreme weather events and estimate the annual cost to Canadians at $5 billion by the year 2020, and $21 to $43 billion by 2050. “There is evidence from around the world that natural catastrophes are on the rise,” states the report. It goes on to talk about unprecedented damage caused by the Calgary and Toronto floods of last summer. It also talks about the ice storm that struck Toronto in December although the economic impact in terms of dollars is not recorded in the Top 10 chart displayed below. Note the dollars trending upward over the 10 years displayed here.

In 2013 the Insurance Bureau of Canada released data on severe weather losses across the country. It was a record $3.2 billion.
In TD’s report it further reinforces what the Insurance Bureau is seeing in the trends and states the following:

The bank report concludes that there is little sign that this trend will alter and advises business and government to “start thinking of the long term-implications, and place a larger emphasis on catastrophes when making investment decisions. Businesses need to identify how these events impact their bottom line and adjust long-term financial plans accordingly. Governments need to takea close look at their inventory of infrastructure to identify vulnerabilities and areas where proactive adaptation can prevent future damages, loss of life, or economic disruptions. Awareness and preparation is the first step toward ensuring the safety of people, property, and prosperity.”
When a bank starts telling the government and industry to sit up and take notice about the change that is occurring around the country and the world you might think that they would take notice. Currently, however, the Government of Canada remains on a course of unfettered expansion in the resource sector regardless of whether the industrial impact may be a contributing factor to the growth in the number and cost of natural catastrophes brought on by weather events.
In every respect the bank is saying the same things that can be found in the recently published IPCC report produced by scientists from around the world. The only difference is the word “weather” has replaced the word “climate.”
Our hotel, the Holiday Inn – Toronto Centre, were the most gracious hosts to an encampment of families, retirement home residents, and an assortment of pets – dogs, cats and even birds. I cannot say enough positive things about the staff and the service they provided. So many of them had no power at home and yet they never lost a step helping out hotel guests even though they had no place to go to find warmth at the end of their shift.
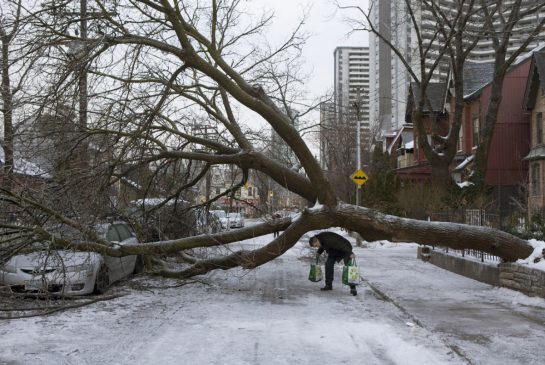
People were parked in the lobby with assorted bags containing household items they grabbed before seeking shelter from the cold that descended on Toronto after the ice storm with temperatures dropping to the minus mid-teens Celsius (near zero Fahrenheit) and windchills that made it considerably colder. With 30-40 millimeters (over an inch) of ice on trees and some wind the millions of trees that are a feature of Toronto were the chief natural victims, losing limbs if not trunks in the icy onslaught. And now it is snowing here on Christmas Day while I watch a very large limb across the street from me bend a power line closer and closer to the ground. They have marked it off with tape in the last few minutes but no one has come as of yet to cut it down before it takes down the power to another set of homes.

It will be days before all the power is restored. As of this writing over 70,000 “customers” in Toronto (a customer equals 2.5 people based on Toronto Hydro’s definition) have no power and it may be New Years Day before they get it back. Another cold front will move in by the weekend. I cannot imagine what it will be like for these people if they have not found a warming shelter as a safe haven.

Which brings me to the topic of today’s blog. What should a city like Toronto learn from weather events like this one? Here are some suggestions:

I would welcome you, my readers, to suggest other ways cities in the 21st century can withstand the onset of weather events like the ones that seem to be increasing in frequency. So fire away with comments here, on the Facebook 21stcen site, or on The Futurist blog site.
The first ice storm in March 2007 drove us from our home with dog in tow after our house dropped to freezing. In this one we were taking no chances. Found a hotel right away along with hundreds of others. And this storm aftermath is expected to drag on for days as trees continue to crash onto power lines under the weight of the 30 miilimeter coating of ice. When I walked our dog yesterday one of those falling trees just missed us. Heard the crack and covered my head with my hand reflexively. The tree landed a mere half meter from where I was standing. When I looked behind me an entire section of a massive tree lay on the road and sidewalk.
The two issues that seems clear to me from this and previous extreme weather events that Toronto has experienced since 2000 are the increasing frequency and intensity. In one day this last summer Toronto saw more rain fall in a few hours than had ever fallen in the entire month of July since weather records were kept. This ice storm will set records as well beating the 2007 event by a country mile.
If it’s not climate change it sure is wonky weather. And wonky is becoming the new normal for us here in Toronto. It’s not just our mayor that’s a blowhard. So is the weather.
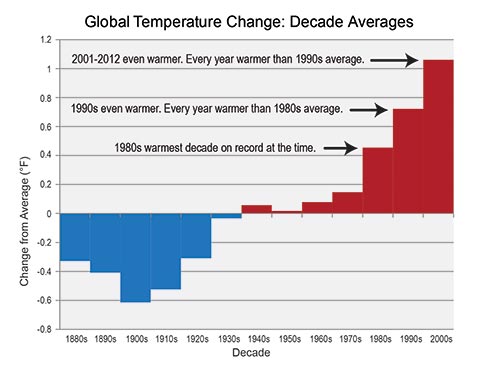
]]>In their conclusions the scientists stated that no single weather event proves that we are experiencing human-induced global climate change. But the frequency of unusual weather events may be an indicator of a shift away from normal climate patterns. In their cataloguing of extreme weather events one thing became exceedingly clear. The Earth is experiencing more extreme weather events than at any time in recorded history and that the events are more extreme – heavier rain and flooding, more violent storms, larger and more frequent tornadoes, and more prolonged droughts and heatwaves.
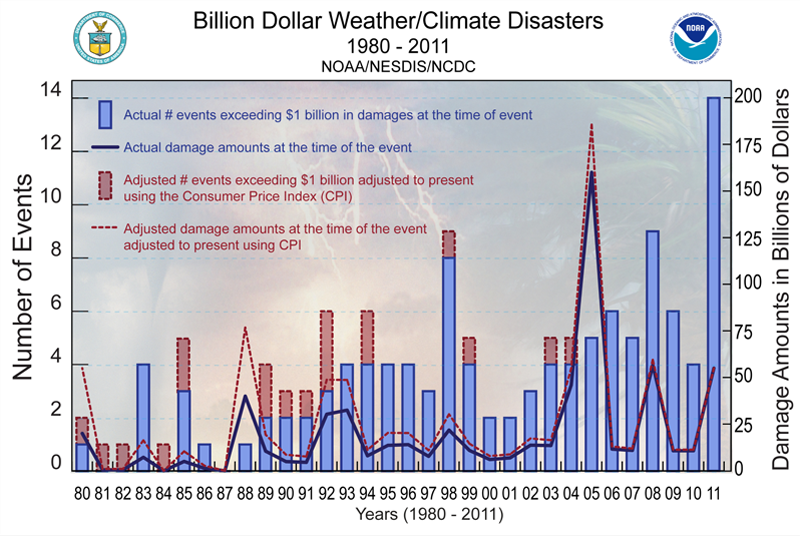
Coumou and Rahmstorf’s data shows that globally we are experiencing three times higher monthly heat records in the 21st century than at anytime in our past. Like other climate scientists they recognize that local weather variation is not proof of global warming, but the pattern that is emerging suggests something is happening with the most likely variable in the climate model being us. We are the influence that is causing global temperatures to rise. And when the atmosphere gets warmer, weather gets more active and weather events become more extreme. So although we cannot unequivocally state that extreme weather reflects climate disruption, we can see cause…not certainty….but high probability.
]]>


