The post Twin and Triplet Cyclones Forming in the Pacific During an El Niño Year appeared first on Techso Mogro.
]]>This is happening as the next El Niño is predicted to emerge by June. It is not the first time twin or triplet storms have formed, but they usually occur after an El Niño event.
What does it mean for the Pacific islands in the path of any one of these storms? Heavy rains, extreme heat, flooding, landslides, storm surges, and high winds, in other words, not good times ahead for these island nations.
Scientists at NOAA state that atypical convection currents and wind patterns over the equatorial Pacific cause cyclonic storms to form. With no large landfalls to dissipate the accumulating energy and moisture, the swirling winds develop a classic hurricane signature with a central low-pressure eye as seen in the storm on the lower left in the image above. This storm lies to the east of Papua New Guinea and north of Queensland, Australia. Weather models indicate the three storms could slow down, becoming nearly stationary over the next week. What that will do is create an enormous hot spot in the Western Pacific with rainfall levels between 127 and 254 centimetres (50 to 100 inches). Papua New Guinea is forecasting flash floods and landslides.
These triplet storms occurring at the beginning of April are a significant sign, with climate scientists stating that their arrival indicates that the planet continues to run a fever and that the rate is accelerating.
This will feed an early occurrence of the next El Niño, creating a hot spot that will push warm water from the Western Pacific to the coast of South America, forming an enormous feedback loop which will cause more thunderstorms and stronger westerly winds.
States Zele Hausfather, the chief scientist at C3.ai, cofounder and chief scientist of Efficiency 2.0, a Breakthrough Senior Fellow and research scientist at Berkeley Earth, told The Washington Post, that the arrival of the El Niño will “push up our estimate for 2026 global temperatures, and make 2027 very likely to be the warmest year on record.”
NOAA is predicting a super El Niño in 2026 through 2027. James Hansen’s climate models support NOAA’s prediction. Hansen, the man who is most associated with breaking the story about anthropogenic climate change, believes this El Niño will be the strongest on record, affecting global weather patterns. It will be a super El Niño. They typically occur once every 10 to 15 years, but now, the rate of recurrence is faster with climate conditions persisting much longer and ranging much further.
What does a super El Niño mean for conditions in the tropical Atlantic? Fewer hurricanes in 2026, into 2027. Fewer hurricanes, however, don’t equate with less powerful ones. Previous low hurricane years have produced some of the strongest on record.
U.S. Defense Department meteorologist Eric Webb, whose handle is @webberweather, describes the increased frequency in El Niño cycles as follows:
“The climate system cannot effectively exhaust the heat released in a major El Niño event before the next El Niño comes along and pushes the baseline upward again.”
Why can’t the climate system get rid of the heat? Human-created carbon and other greenhouse gas (GHG) emissions are the pump feeding modern climate change. This isn’t Mother Nature variability. This is us, and the faster we turn down the flow of our GHG pump, the sooner we can slow down the change we are creating.
The post Twin and Triplet Cyclones Forming in the Pacific During an El Niño Year appeared first on Techso Mogro.
]]>The post Are El Niño/La Niña Cycles Speeding Up The Rate Of Global Climate Change? appeared first on Techso Mogro.
]]>Today, Hansen and his colleagues, Pushker Kharecha, Dylan Morgan and Jasen Vest, published their latest findings and predictions, noting that we are heading for another El Niño, three years after the last one, describing it as a faster cycling than normal. They predict, as a result, a new record global high mean temperature in 2026 and a higher one in 2027. They believe the trend points to a 2°C (3.6°F) mean temperature rise by the 2030s, faster than previous mid-century predictions. The following graph plots global surface temperature data from 1950 to the present, showing how El Niño highs recently have surpassed the Paris Climate Agreement lower target of 1.5°C (2.7°F).

Currently, we are at the back end of an El Niño/La Niña (ENSO) cycle with the trade winds of the equatorial Pacific Ocean pushing warm surface waters west and causing upwellings of cold water from deep in the ocean to surface off the coast of South America. As plotted in the graph above, the normal cycle in atmospheric temperatures is directly related to this recurring ocean phenomenon.
Being at the bottom end of the ENSO cycle puts us in the cool La Niña phase. Latest climate modelling suggests an end to this phase of the ENSO cycle by early summer with the return of another El Niño. Why? Because upper ocean heat is rising faster than in the past, with peaking near the end of this year.
The current scientific consensus has yet to determine with certainty whether the rate of ENSO cycles is speeding up. A 2022 paper in Nature Communications projected faster onsets and slower decays for El Niño events this century. A 2023 paper in the journal Nature concluded that ENSO cycle rate change remained uncertain.
Why would a shift in warm surface water in the equatorial Pacific Ocean change the weather here in Toronto, or elsewhere in North America, Europe, and Africa? Considering the locale of this phenomenon, it makes sense that the ENSO cycle should affect East Asia, Australia, Pacific island nations and South America. But in fact, this recurring warm El Niño phase followed by the cooler La Niña profoundly influences the Americas, Asia-Pacific, Africa and Europe.
In Canada, where I live, El Niños typically cause warmer, drier winters while La Niñas cause cooler temperatures, rain and more snow for the eastern half of the country. The recent polar vortex that settled over much of Eastern Canada and the U.S. vausing iguanas in Florida to fall out of trees, has its roots in the current La Niña. A cooler Eastern Pacific Ocean destabilizes southern air masses, which makes winter Arctic air creep south and causes dramatic oscillations in the Jet Stream. The two pictures below show the stable El Niño phase on the left, and the pattern that comes during La Niñas on the right.

Climate models projecting to 2100 are in line with what Hansen and his associates are gleaning. The aforementioned 2022 paper predicts a 33% increase in La Niña events and a 20% increase in El Niños by 2100 from climate forcing feedback caused by GHGs in the atmosphere. If emission levels begin to drop, the ENSO cycles will continue to rise, but at a slower pace.
Warming implications aren’t limited to the atmosphere. The warmth in the atmosphere will increasingly be absorbed by the ocean, leading to deep ocean warming, which in turn will amplify the heat in the air and El Niño frequency. Unlike ocean surface warming, deep ocean heat will last for centuries, contributing to future climate extremes.
The post Are El Niño/La Niña Cycles Speeding Up The Rate Of Global Climate Change? appeared first on Techso Mogro.
]]>The post Is The Planet In Hot Water Or What? appeared first on Techso Mogro.
]]>Roughan notes that 90% of the heat that gets trapped in the atmosphere because of greenhouse gas emissions ends up in the ocean. Normally, the vertical displacement of warm surface water by deeper cold water offsets the heating. But that is not what is happening now.
Why wasn’t this phenomenon detected before? Because the cycling of La Niña, and El Niño events masked the overall thermodynamics. With the latest La Niña waning after three years, the cause of cooler conditions overall, we are now due for a new El Niño which should see global atmospheric temperatures rise.
Roughan notes a change in the normal upwelling of cold water off the coast of South America. This phenomenon keeps Pacific Ocean surface waters cool. But it is not happening as the new El Niño begins to take shape.
The El Niño which is also known as the back half of the Southern Oscillation cycle that repeats between every 3 and 7 years, has been responsible for creating the fire weather that plagues Australia, droughts in Indonesia and South Africa, torrential rain and flooding events in parts of South America, and disruptions to the lucrative local fisheries off South America’s coast. It is associated with Amazon rainforest loss and with years when sea ice in the Arctic is at its lowest. And El Niño is seen as contributing to the increasing range of vector-borne tropical diseases.
With the cold ocean current conveyor belt off South America impacted negatively, the western Pacific will see the ocean absorbing even more of atmospheric heat which penetrates to a depth of 2 kilometres (1.2 miles) beneath the surface. With the average ocean depth being 4 kilometres (2.4 miles), it means that half of the total volume of the ocean is being affected.
Roughan quotes from a study of just how much extra heat Earth’s atmosphere has trapped between 1960 and 2020. A subset of the data from 1971 to 2020 shows that the planet has absorbed 380 zettajoules of extra heat or the equivalent of 25 billion nuclear bombs. Consider the ocean has taken up 90% of the extra heat and you can see why we are getting into hot water which is not confined to the tropics, but rather is spreading to the poles.
An article appearing in The Washington Post on April 28, 2023, quotes a senior scientist from the U.S. National Oceanic and Atmospheric Administration (NOAA) who states “You’ve got this relentless rise of greenhouse gasses in the atmosphere….we just know unless that turns around in some way, we will continue to set records.” Another NOAA scientist notes that by 2024 as the coming El Niño strengthens we should see “new highs in global mean surface temperatures.”
A side effect of a warmer ocean is thermal expansion which threatens coastlines as sea levels rise. Warmer surface water feeds the cycle of hurricanes in the Atlantic, cyclones in the Indian Ocean, and typhoons in the Pacific. Warmer surface waters increase evaporation which supercharges rain events. Warmer surface waters reinforce air temperature warmth. The ocean-to-air water cycle sees a 2.2% increase in water vapour volume for every one Celsius (4%i per one Fahrenheit) degree increase in air temperature.
Ocean warmth is unevenly distributed with some areas warming faster than others. This is largely influenced by ocean currents. For example, the Gulf Stream off the U.S. eastern seaboard is altering temperatures and weather patterns for the U.S. northeast.
A conclusion drawn by climatologists and oceanographers states that the warming regardless of what we do to slow greenhouse gas emissions and reverse our contributions is likely “irreversible this century.” So indeed, we are in hot water like the proverbial frog in a pot sitting on top of a lit stove.
The post Is The Planet In Hot Water Or What? appeared first on Techso Mogro.
]]>The post Global Warming’s Assault on the Great Barrier Reef appeared first on Techso Mogro.
]]>I’m not sure what sources my brother’s neighbour was citing to state his opinions on the subject. Was it personal observation that led him to make this declaration? Or was it hearsay or information provided by the Australian government that led him to this conclusion? Maybe his source was former Prime Minister Tony Abbott who single-handedly eviscerated Australia’s climate change research budget while he was in office. Or maybe it was the current PM Malcolm Turnbull who is on and off again about climate change and what activist policies the government can take.
One thing for sure, the science says otherwise.
In the latest article posted at Smithsonian.com, the website for America’s Smithsonian Institution, 2016 was “the worst die-off in the reef’s history.” The worst bleaching happened when sea temperatures hit record highs in March and April of 2016. The damage saw 63% of corals in the northern and 6% in the central reef die. Bleaching does not necessarily indicate that the coral cannot recover, but what is needed to ensure a return to normal conditions is cooler ocean water.

The indicators are not good for the reef because measured surface temperatures indicate more warming, not less. In the latest Australian government briefings on the reef, it notes that temperatures are even warmer than last year when bleaching began. Spot checks of six reef habitats in recent weeks show 60% bleaching in the northern portions of the reef and in areas previously not hit by last year’s events.
Who or what is to blame?
Climate change and periodic El Ninos are both cited. A suspected new El Nino is starting in the equatorial Pacific right now and all indications point to it being as big and prolonged as the last one which developed in 2014, continued through 2015 and finally subsided early in 2016. That El Nino event not only damaged the reef but played havoc with weather across the world.
In a new report by Michael Le Page, appearing in New Scientist, he writes about an unprecedented four-year bleaching of coral reefs around the world with the Great Barrier Reef being the number one exhibit showing the extent of the damage. Le Page notes that the La Nina cooling in 2016 has not produced cooler surface temperatures as in past cycles. The result, the National Oceanic and Atmospheric Administration (NOAA), through satellite monitoring, is predicting significant bleaching and coral deaths in 2017.
NOAA released the satellite map seen below on February 21. It indicates forecasted coral bleaching from thermal stress for the period from March to June of this year. Note the areas off Australia’s northeastern coast are, either at Alert Level 1 or 2 in terms of future bleaching.

In 2016 observations, NOAA (which may see its budget cut dramatically by President Trump) reported 93% of the Great Barrier Reef experiencing bleaching as of April of that year. I assume this satellite data was shared with the Australian government and its people. I gather, however, that the message didn’t reach some of those visiting the country.
One must point out that the second and non-physical culprit to be blamed for the decline of the Great Barrier Reef, is the government of Australia, itself. Australia says it has a 35-year plan to protect the reef. Published in 2015 it states that the government is dedicated to improving the reef every decade to restore it to its past extent and health by 2050. The current reef damage points to a far different outcome both in the near and far future. And when you look at Australia’s maritime policies regarding shipping lanes that cross the reef from Queensland’s super port at Gladstone, it is highly unlikely that this or any future Australian government will have a positive impact on the corals and the ecosystem the Great Barrier Reef supports.

So what can Australia do to protect the reef and restore it?
The Reef Trust formed by the government is focused on ways to eliminate sediments from runoff, culling coral predators like the crown-of-thorns starfish, and improving Australia’s coastal habitats to improve water quality. But what the government cannot do directly is stop an El Nino from happening. Over the long term, if Australia were to curb its domestic use and export of coal for use in thermal power generation and steel production (coal is a significant source of greenhouse gas emissions), it could indirectly impact the reef’s future. But mega coal mines, supported by the national and state governments in Australia, continue to be developed.
The post Global Warming’s Assault on the Great Barrier Reef appeared first on Techso Mogro.
]]>The post 409.44 Parts Per Million – Remember 2016 as the Year CO2 Went Ballistic appeared first on Techso Mogro.
]]>This number will abate as the Earth inhales and exhales in its annual cycle. With summer about to arrive in the northern hemisphere new plant growth will perform as a carbon sink sucking CO2 from the air. But don’t expect to see the cyclical drop to go below 400 ppm as has happened in recent years.

The recorded accumulated rise since March 1958 when the first measured at Mauna Loa has now increased by nearly 100 ppm. And 12 other sites around the globe verify that the levels observed in Hawaii can be found everywhere.
In the past month newspapers have reported that our shift to renewables and the decline in coal use has stalled anthropogenic CO2 emissions these last two years. In its latest report the International Energy Agency states that its sector released 32.1 billion tons of CO2. Other human industrial activity make up the balance of the estimated 40 billion metric tons of CO2 released.

So why did Mauna Loa record a spike? There are several reasons:
Climatologists have noted that El Ninos cause CO2 levels in the atmosphere to rise. One of the reasons is the warmer ocean surface water associated with El Nino events releases CO2 into the atmosphere. The location of the warming surface waters also plays a role by altering tropical rainfall patterns leading to droughts and die offs which turns normal carbon sinks into emitters.
And here is a more significant issue. Although we have seen a 5 ppm rise this year it has happened during the El Nino. If we look at past El Nino CO2 boosts the gas post-El Nino rises even higher. That may mean we will see in 2016 and 17 even more significant spikes in CO2.
At 400 ppm we have witnessed a rise in global mean temperatures of 1 Celsius (1.8 Fahrenheit). With every uptick in the CO2 counter climatologists expect annual mean temperatures to rise even further. And when you consider that this March was globally the hottest in recorded history it’s disconcerting to look at the snail’s pace level of progress our political leadership is making in addressing policy to begin to mitigate the growing crisis. How much longer can we be the frog in pot of water sitting on top of a stove burner?
The post 409.44 Parts Per Million – Remember 2016 as the Year CO2 Went Ballistic appeared first on Techso Mogro.
]]>The post Pacific Blob Weakens While El Nino Intensifies – Weather and Climate Change in One appeared first on Techso Mogro.
]]>The North Atlantic Cold Blob
A recurrence of this phenomenon on a lesser scale is happening in the North Atlantic today. This time the source of colder freshwater isn’t a North American glacial lake. It’s Greenland where the onshore ice masses are melting at a record rate discharging cold freshwater into the adjacent ocean where it is pooling and impacting the movement of water from the Gulf Stream to Europe’s coasts, a phenomenon known as The North Atlantic Drift. The Drift brings warm Gulf of Mexico water to European shores making winters there milder than locales in North America at similar latitudes. To illustrate check out today’s temperatures in St. John’s, Newfoundland which sits at 47 degrees, 37 minutes north with St. Nazaire and Nantes in France approximating the same latitude. The former’s high hit 3 degrees Celsius (37 Fahrenheit). The latter was 9 Celsius (16 Fahrenheit) warmer. Clearly the cold blob seen in blue on the map below has, as yet, to impact St. Nazaire or Nantes this winter, but it may soon if Greenland continues to experience record melts.

The Eastern North Pacific Warm Blob
This winter it isn’t the cold blob that is making the headlines compared to the 2-years’ running warm blob located in the North Pacific as seen in the U.S. National Oceanic and Atmospheric Administration (NOAA) produced map below.

To give you an idea of the extent of this phenomenon, it is a warm patch of ocean approximately the area of Alaska with a depth of 100 meters (330 feet) and temperatures 2.8 degrees Celsius (5 Fahrenheit) warmer than historical average.
What’s the cause?
Likely a change in atmospheric circulation over the North Pacific leading to a persistent high pressure ridge, clear skies and lower wind speeds. The result is a greater exposure of the surface to sunlight whose energy converts from photons to heat when absorbed by the seawater. Climatologists speculate that the thinning of the extent of Arctic summer sea ice correlates directly to the blob’s appearance.
The phenomenon predated the current El Nino by two years and is believed to be partly responsible for California’s current altered climate of prolonged drought.
If there is any good news it is recent observations that the blob may be dissipating. For parched California and the Colorado River basin to the east this may be welcome relief. But not necessarily for long, says climatologists, because climate change is expected to continue to alter atmospheric circulation returning these conditions not once a century but once a decade. That’s not good for California and the Colorado and certainly not good for the biodiversity of the American West and Pacific coast.
El Nino is Not the Blob
But blob or no blob, El Nino, that cyclic event that tends to occur just before Christmas, impacts the equatorial Pacific every few years. In its return this time it is expected to be equal to or more intense than the record event of 1997-98. Every El Nino transfers warm water from the western Pacific to the east. the redistribution of heat ups the surface water off South America’s west coast. It’s not just warmer, it also expands raising sea levels.
The phenomenon wreaks havoc on rainfall patterns because of the heat transfer. Southeast Asia experiences extreme weather events from drought and wildfire outbreaks to massive flooding in Indonesia and South Asia. El Nino events impact the timing of the annual Indian Ocean monsoon by delaying it several weeks.
The warming shift from west to east is also associated with widespread Pacific Ocean coral bleaching, lowering sea levels in the western Pacific and raising them in the east. It is associated with more intense Pacific typhoons.
El Nino events reach even further impacting North America, Europe, and Africa. The 1997-98 El Nino caused extensive rainfall in the United States southeast, and abnormally warm winters throughout much of North America. Abnormal warmth in northern latitudes is not necessarily a good thing. Insect pests that succumb to the cold thrive. The Mountain Pine Beetle and Emerald Ash Borer are two that have enjoyed El Nino’s beneficence.
The current El Nino appears to be even more intense than the one in 1997-98. It may end California’s drought but not necessarily in a good way. The parched soils may be subject to saturating rainfalls leading to mudslides and rapid runoff.

And the World Health Organization and United Nations are gearing up for what will probably be an El Nino induced famine in Africa from the Horn to southern portions of the continent as dramatic drops in precipitation at the outset of the growing season lead to crop failures.
Even ocean life is being impacted. Surveys off California and western South America’s coasts show invasive species occupying domestic species’ habitats and competing for food. One example is California’s sea lions who have experienced changes to their normal food sources forcing them to seek other prey. The combination of Pacific blob and El Nino may duplicate conditions that led last year to a record number of abandoned sea lion pups stranded on Southern California’s shores. Mother sea lions couldn’t find enough to eat to lactate and feed their babies.
Weather and climate change are intersecting. With the El Nino’s impact expected to linger for the next six to nine months the phenomenon appears to be supercharged by a general atmospheric warming over the entire Pacific. The confluence of a warming atmosphere with the repetition of the El Nino phenomenon is taking us into uncharted waters.
The post Pacific Blob Weakens While El Nino Intensifies – Weather and Climate Change in One appeared first on Techso Mogro.
]]>The post Did You Know that Forest Fires in Indonesia Influence Rainfall in the United States? appeared first on Techso Mogro.
]]>
Today we take data from observation satellites to do pattern analysis and this allows us to derive some pretty interesting conclusions. What we are learning is how climate influences us and how we influence it. And in addition we are learning that a physical phenomenon that is not weather happening in one area of the globe can have significant impact on climate elsewhere. For example, here are some interesting observations from studying El Nino events in the Pacific Ocean over the last few decades. El Ninos correlate directly with extreme weather patterns from Australia to California to eastern North America and beyond. Here are just a few of those correlations:
Since we are using the El Nino as the example, exactly what is it? First observed off the coast of Peru and Central America it refers to a warm ocean current that appears near Christmas (hence El Nino, referring to the birth of the baby Jesus). The Peruvian fishery collapse associated with this invasion of warm water has an enormous impact on those countries dependent on this food and revenue source. But the impact of an El Nino is far more pervasive than that. It influences the path of jet streams over North and South America. It raises sea levels causing storm associated higher than normal coastal flooding and erosion. It changes winter in western North America making it warmer and drier and encourages the opposite impact on winters in eastern North America which become colder and wetter (remember the recent winters eastern North America has experienced and you begin to see what I am talking about).
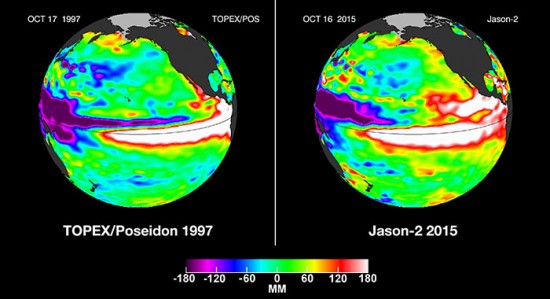
Where El Nino events in the past might have occurred in cycles of up to seven years, now it appears the time between cycles is shortening. A new El Nino event for the Christmas period of 2015 has been observed by current Earth observation satellites, one of them Jason-2, a NASA and NOAA joint project. This new El Nino appears to be the most significant since the late 1990s and is expected to impact precipitation and temperatures across all North America.
NASA’s fleet of Earth observations satellites are tracking the impact of this El Nino. For example, one satellite measures precipitation every three hours. Another reports surface soil moisture levels. Data collected will help scientists, engineers and farmers put into place adaptation and mitigation strategies to offset El Nino climate impacts.
To get a sense of how significant this year’s El Nino will be take a look at the comparison based on data collected from 1997 with that of the present. The large white bands spanning the Earth’s equator show the extent of the ocean surface warming and this year’s is bigger than what was observed in 1997, the former record holder.
The post Did You Know that Forest Fires in Indonesia Influence Rainfall in the United States? appeared first on Techso Mogro.
]]>The post Headlines: Commenting on the Most Recent Australian Heat Wave appeared first on Techso Mogro.
]]>

Do four days of above 40 Celsius (104 Fahrenheit) provide examples of human-induced climate change or is this just a variable weather incident that one sees in summer from time to time? In Australia the four days of plus 40 created a national debate because the new federal government has been scrapping all previous initiatives focused on reducing carbon consumption. It has scrapped the carbon tax. It has defunded climate science as practiced by government departments.
The sight of professional tennis players withdrawing from tournament play because of tormenting heat, however, has ratcheted up the conversation. Add to that a story last week about 100,000 fruit bats falling from the skies because of heat stress, and you get a picture of what might seem to be a continent beginning to overheat.

Australia is the hottest of the continents and vies with Antarctica for the title as driest on the planet. In the last couple of years Australian weather maps have added a 50 Celsius degree isotherm to their weather charts. Recently Australians crowdfunded the work of the former government department to create the Climate Council from the defunct Climate Commission. That’s because the citizens in Australia seem to recognize what is going on while their government turns a blind eye.
Is this hot weather or a heating planet? It appears to be the latter. Why? Because heat waves in Australia’s summer usually coincide with the El Nino warming of the tropical Pacific. But the most recent extreme heat waves are taking place during a period when the El Nino has not appeared.
It must be stated that it is not the daytime extreme temperatures that are a measure of a warming planet, but the fact that nighttime temperatures are much higher than norms. Where daytime highs reached 42 and 43 Celsius degrees on four consecutive days from January 14 to the 17, nightime lows varied between 24 and 29. The lows were the mean average temperature for Melbourne in the summer, and mean is the weighted average of temperatures throughout the day. You can check out the graph of temperature highs and lows for the city over this last week in the chart provided below.

Melbourne, located at the southern tip of Australia is considered to have temperate climate with average July temperatures of around 25 Celsius. So the heat wave that struck the city during the Australian Open is an aberration. But for the continent it appears no longer to be the abnormal. Australia keeps setting new records for heat. Last year was the hottest on record. And with the heat has come prolonged drought as the continent appears to be drying out. So is this latest heat wave climate change or weather? Well the truth is it’s weather that depicts a climate trend and that trend points to profound change.
The post Headlines: Commenting on the Most Recent Australian Heat Wave appeared first on Techso Mogro.
]]>The post Headlines: El Nino and La Nina in a Warming World Will Become More Extreme appeared first on Techso Mogro.
]]>Scientists have recognized the ENSO phenomenon since the 1920s. But it wasn’t until the 1990s that an El Nino was fully described from start to finish. Today Earth observation satellites track ENSO and predict occurrences by measuring ocean surface temperatures, surface winds, ocean colour and precipitation. Typically the El Nino part of ENSO begins with a warming of the eastern mid-Pacific Ocean. This warming has been associated with intense weather events from Australia to western North America where it has been blamed for floods.
But the new climate model predicts the warming atmosphere will alter upper ocean currents in the equatorial Pacific with easterly flows becoming enhanced during El Ninos and westerly flows enhanced during La Ninas. The westerly flows show weakening under global warming doubling the occurrences of El Ninos.
The lead author is Dr. Scott Power of the Australian Bureau of Meteorology who has stated that global warming will exaggerate and increase ENSO-induced droughts and floods setting new records from more extreme weather events.

The post Headlines: El Nino and La Nina in a Warming World Will Become More Extreme appeared first on Techso Mogro.
]]>The post Environment Update: Violence a Consequence of Rapid Climate Change appeared first on Techso Mogro.
]]>In the 20th century world wars were fought over “lebensraum” and resources. German xenophobia and racist policies fueled a European and North African conflict while Japan fought to dominate South and East Asia in pursuit of resources and markets. Tens of millions died not just on battlefields but in a murderous descent to barbarity the world had not seen in hundreds of years.
Here in the 21st century we have moved away from global warfare. In fact the world has never been more at peace with most conflicts confined to regional battles such as the Syrian civil war. But will this pattern hold in light of climate shifts, disrupted ecosystems and declining natural resources? One of these two studies says “no.”
Climate change is correlated to increasing domestic, ethnic, police, civil and international violence and conflict. Past studies have correlated the El Nino or Southern Oscillation with global patterns of civil conflict. But this latest study links drought and higher mean temperatures to spikes in domestic violence, assaults, murders, ethnic violence and civil wars from Australia to Europe to the United States, Africa and China. The lead author, Solomon Hsiang, a postdoctoral fellow at Princeton University and now an assistant professor of public policy at UC Berkeley, states: “We collected 60 existing studies containing 45 different data sets and we re-analyzed their data and findings using a common statistical framework. The results were striking.” Increased personal violence. Increased intergroup violence. And increased government breakdown. The study’s conclusions: A 2 Celsius (3.8 Fahrenheit) rise in global temperature will result in a 50% increase in the rate of intergroup conflicts.
In the second study out of Stanford University, researchers projected that the rate of climate change in the next century could lead to drastic changes affecting the acidity of oceans, sea levels, and weather patterns. The scientists looked at the last time the planet experienced a 5 Celsius (9 Fahrenheit) rise in temperatures. This occurred 20,000 years ago with the end of the last Ice Age. During that transition as the ice retreated northward plants and animals migrated as well. In geological terms the time period was relatively short with terrestrial forests reappearing in a matter of centuries in places where ice several kilometers deep once covered the landscape.
The Stanford research team reviewed two-dozen climate models to predict potential outcomes by the end of the 21st century. Their conclusions: temperatures will increase 5 to 6 Celsius (9 to 10.8 Fahrenheit) degrees in the Northern Hemisphere.
If a 2 Celsius rise results in a 50% increase in intergroup conflicts what is the potential level for violence in a world where temperatures rise 5 or 6 Celsius?
Two studies. Together it is hard to ignore their combined implications.
The post Environment Update: Violence a Consequence of Rapid Climate Change appeared first on Techso Mogro.
]]>


