It is not the first time in the planet’s history that climate change has occurred. As Congressman Paul Ryan has reminded us, the climate is always changing. Volcanoes like Mount Pinatubo have caused extended periods of cooler weather in many parts of the planet because of particulate matter clouding the stratosphere for a number of years. Life itself altered the chemistry and atmosphere of the planet affecting climate. But where Paul Ryan goes wrong is where all those “I’m not a scientist” skeptics make the same mistake.
They don’t read! And if they do read they don’t understand the compendium of observed data from 150 years of record keeping.The observable data is what it is.
No scientist worth spit approaches the study of climate change with a pre-stated position that we are the cause of global warming. That kind of bias is not science. It is belief and opinion.
Studying the Observable Record
Scientists study the data and propose hypotheses, and then test these in a lab or through development of modeling tools. This experimentation and repetition helps in finding explanations and discerning patterns.
Scientists studying climate look at all the variables, from the physical Earth, the space beyond Earth, the variability of the Sun, the influence or lack thereof of the magnetosphere that surrounds the planet, in fact, at all and any external force that could explain the observable record.
And what they have discerned is one constant thread through the 150 years of observable data – the uptick in carbon dioxide (CO2) and other greenhouse gases (GHGs) in the atmosphere. The scientists have looked through the data for any natural source of explanation for the rise in these gases. Could the source be the ocean covering 70% of the planet? Could the observable data be part of a natural multi-century planetary cycle that so far has escaped our understanding?
To get answers to these questions the scientists have studied and continue to look at ancient climate histories. They have found periodic rises in CO2 in the past geologic record (gases alter the chemistry of rocks when trapped in sediments that turn into rock over millions of years).
They have analyzed ancient atmospheres trapped in gas bubble found in ice cores from Greenland, Antarctica and alpine glaciers. They have collected lots of data.
But the patterns in these past climates don’t resemble the present uptick. They are gradual occurring over millennia, not 150 years.
Understanding through Modeling Climate
Scientists who study climate use climate models. They know the models they create are not perfect. They are mathematical representations. They simulate atmospheric circulation and composition. They simulate the carbon cycle on the planet. They incorporate the 150 years of observable data on oceans, atmosphere, precipitation, wind, sea ice, and more. There are gaps in some of the data and that’s where the mathematical formulae provide filler with reasonable assurance of accuracy. And then the scientists describe their conclusions in terms of probability of confidence from high to low. In this way the climate models can serve as keys to unlock the future.
That’s why it’s important to understand the evolution of these tools. Current climate models have become more sophisticated as our computer technology improves. Years ago we could process thousands of data points using mainframe computer systems. Today with massive parallel processing computing capacity we can process tens of billions of data points to simulate the Earth in a variety of ways.
We can produce continent-scale models that incorporate every piece of data over 150 years including surface temperature, precipitation amounts and patterns, coastal ocean heat content, frequency of extreme weather events, atmospheric chemistry, clouds, and suspended particulate matter through the entire air column from troposphere to stratosphere. The climate modelers are the first to tell you where they have high and low confidence. In these continental models they admit to high confidence in almost all categories with the exception of clouds and particulate matter where there is insufficient collected data over a long enough observable period to create the same level of confidence.
The same is true for the sophistical ocean climate models we are using today. They effectively simulate thermal expansion, but once again the scientists and mathematicians freely admit that they have lower confidence in understanding the influence of continental glaciers and sea ice on ocean changes. That’s why Arctic and Antarctic studies of changing ice conditions both on the ocean surface and on land masses are so critical. For example only recently have scientists understood why the contradiction exists of shrinking sea-ice mass in the Arctic with a growing mass in the Antarctic. The modeling suffered from insufficient information but with more observable data coming in the knowledge gap has closed.
The “I’m a scientist” scientists focused on climate change admit in their conclusions in the Climate Change 2014 Synthesis Report that some of what they describe may not happen. This is because they need more observable data or they need to better perfect the mathematics of their models upon which they base their confidence in predicting how climate will change. But at the same time they are expressing high confidence in much of what they predict and even then are providing a range of outcomes built around a mean value. This is the caution that the “I’m a scientist” bring to the table when developing hypotheses and modeling tools to explain climate.
In our next posting we will look at projected climate changes the report describes and in future postings we will describe the risks and impacts of those projections, and finally pathways to adaptation and mitigation.
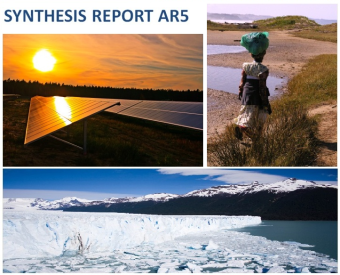
Divided into four parts the first section describes the correlation of observational evidence of climate change with human activity on the planet. The second section projects future climate change and risks. The third includes adaptation and mitigation strategies focusing on sustainable development. And the fourth describes policy approaches to mitigation and adaptation.
For those who state “I am not a scientist” this is a report by scientists. It lays out observations that non-scientists dare not ignore. These include:
In the information above please note there are no predictions about the future, just observations about the past and present. For the non-scientists these are the facts based on planet-wide data record keeping. The data when plotted on graphs shows trends. We will examine those trend scenarios in subsequent postings. But for now I would suggest on evidence of the past and present alone one can ascertain both the near and further future.
So I ask the following to those “I am not a scientist” readers:
For those contemplating the building of another oil or natural gas pipeline, do you now have a better picture of the observable, accumulated data on climate change?
For those energy company executives who believe that the fossil fuel assets they currently have in the ground can be extracted and burned at some point in the near future, does this not give you a clear picture why those may become stranded possibly for centuries or forever?
For national leaders, who find the science inconvenient, because they feel beholden to energy and business interests, or because they believe that technology will at some time come up with a magic elixir to solve anthropogenic climate change, is this not the time to finally end the willful ignorance and act on behalf of those you represent and theirs and your children’s future?


