“We essentially have uncovered an astoundingly abundant supply of food for a hungry world, hidden in plain sight in the farmlands we already cultivate,” says Cassidy. According to her, “36% of the calories produced by the world’s crops are being used for animal feed, and only 12% of those feed calories ultimately contribute to the human diet (as meat and other animal products). Additionally, human-edible calories used for biofuel production increased fourfold between the years 2000 and 2010, from 1% to 4%, representing a net reduction of available food globally.”
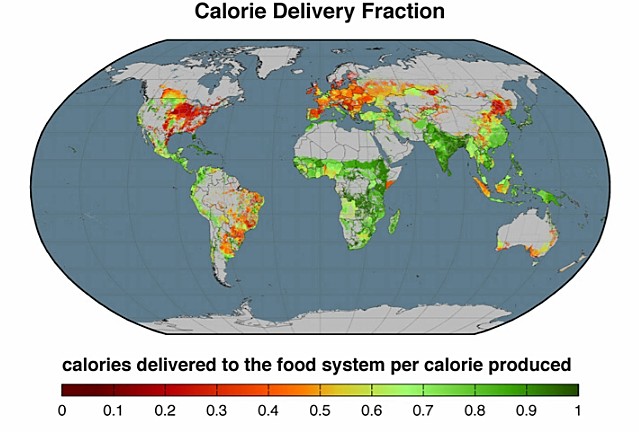
The map above illustrates global distribution of calories delivered to the food system per calorie produced. For example in China 82% of rice calories are delivered to humans for consumption while 77% of the corn produced (China is second to the United States in corn) calories are fed to animals. In fact, 33% of China’s produced calories end up going for animal feed. Brazil shows a similar pattern although the allocation of where the calories go is different with more than half of the soybean crop going to animal feed and much of the sugarcane to biofuel.
Overall the study looked at 41 major crops and what proportion of them were being used for direct human consumption. The conclusions, of all the plant protein we grow, only 49% ends up consumed directly by us.
And here are other interesting statistics. If we converted the land we have tied up today in crops grown specifically for beef, pork and chicken, just in the United States alone, we could feed 1 billion more. And if we applied this globally that number would grow by an additional 3 billion to give us our 4 billion total.
When you consider current global population of over 7 billion with almost 1 billion suffering from malnutrition, and then you project population growth to 9.5 billion by 2050, you can conclude that changing how we purpose the land and what we grow on it gives us more than enough capacity to meet food demands in face of the 2050 population bubble. In fact the carrying capacity of the planet is far greater than we realize. See my posting in 2012 on this same subject.
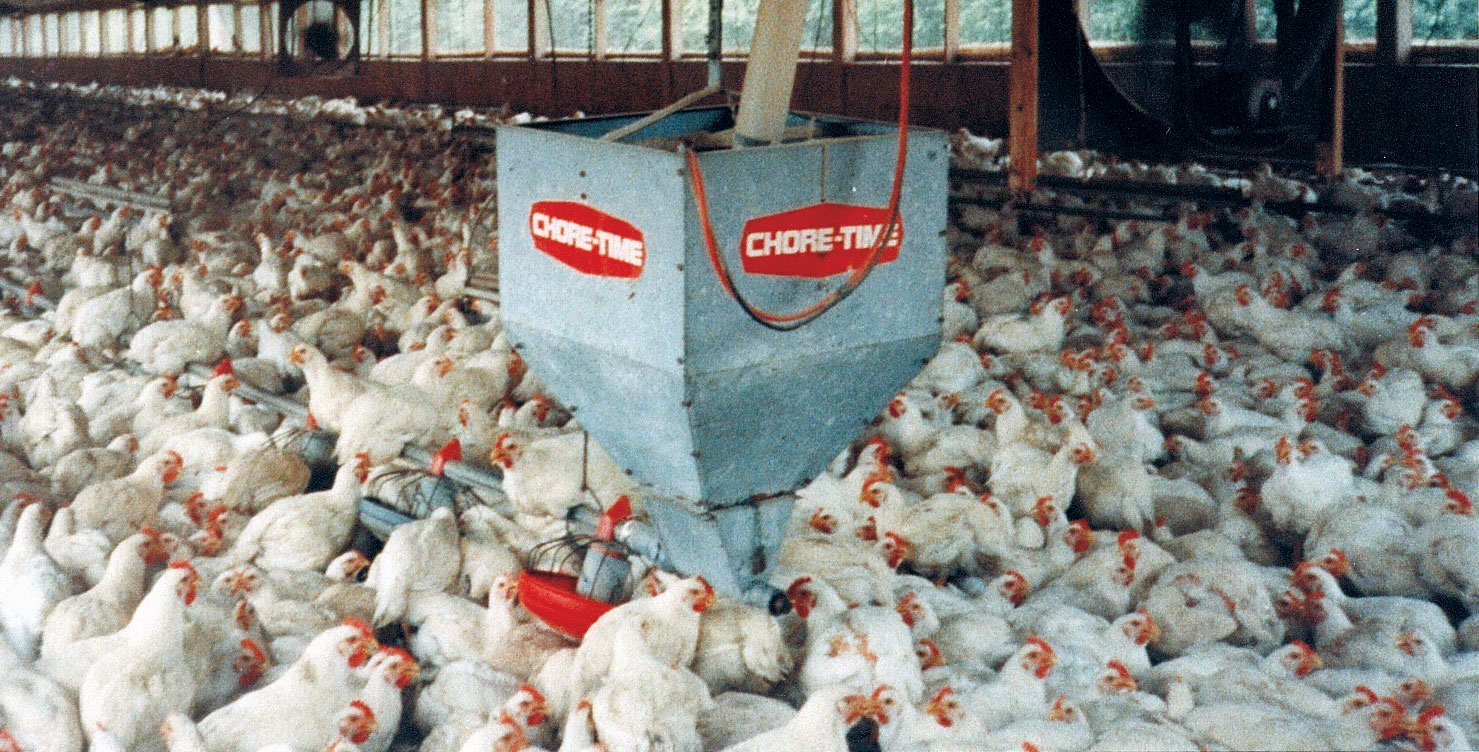
What is ecological footprint? How is it measured? What are the implications of it in real world terms?

Ecological Footprint – is the amount of resources needed by a single individual to survive. By inputting a wide range of data scientists have calculated the current human population’s ecological footprint as equal to 1.5 Earths.
Those who measure the ecological footprint include Mathis Wackernagel, currently President of the Global Footprint Network, and William Rees, a researcher at University of British Columbia in Canada. They first defined the term and attempted to calculate what would be the equivalent unit of area needed by each human to maintain that individual’s current style of life. They called these units global hectares. A global hectare takes into consideration cropland, grazing area, forest lands, fish habitat, carbon output and urban space requirements to sustain a human. Since 1993 there has been continuous monitoring of the ecological footprint with some startling statistical results which you can see in the following table. In selecting the data presented here I have included all regions of Earth and representative countries from each region.
| Country/Region | Population (millions) | Ecological Footprint 2008 (Global Hectares/person) |
| High-Income Countries |
1,037.0 |
5.6 |
| Middle-Income Countries |
4,394.1 |
1.9 |
| Low-Income Countries |
1,297.5 |
1.1 |
| Africa |
938.4 |
1.4 |
| Nigeria |
150.7 |
1.4 |
| Republic of South Africa |
49.3 |
2.6 |
| Middle East/Central Asia |
382.6 |
2.5 |
| Afghanistan |
29.8 |
0.5 |
| Israel |
7.1 |
4.0 |
| United Arab Emirates |
8.1 |
8.4 |
| Asia-Pacific |
3,725.2 |
1.6 |
| Australia |
21.5 |
6.7 |
| Bangladesh |
145.5 |
0.7 |
| China |
1,358.8 |
2.1 |
| India |
1,190.9 |
0.9 |
| Singapore |
4.8 |
6.1 |
| South America |
390.1 |
2.7 |
| Brazil |
191.5 |
2.9 |
| Colombia |
45.0 |
1.8 |
| Central America/Caribbean |
66.8 |
1.7 |
| Cuba |
11.3 |
2.5 |
| Haiti |
9.7 |
0.6 |
| North America |
448.9 |
6.2 |
| Canada |
33.3 |
6.4 |
| Mexico |
110.6 |
3.3 |
| United States |
305.0 |
7.2 |
| Europe |
733.2 |
4.4 |
| Albania |
3.2 |
1.8 |
| Bulgaria |
7.6 |
3.6 |
| Germany |
82.5 |
4.6 |
| Netherlands |
16.5 |
6.3 |
| Russia |
143.2 |
4.4 |
The totals in the right-hand column may surprise you in the case of some countries. For example compare Germany to the United States. Both countries enjoy very high living standards but Germans consume far fewer resources to sustain their lifestyle than Americans. In Africa, South Africans use almost twice the resources of Nigerians. And in Asia-Pacific Australians use more than seven times the resources of people in India and nine times of those living in Bangladesh.

How Does Ecological Footprint Relate to Carrying Capacity?
First of all, what is carrying capacity?
Carrying Capacity – is the maximum population that the planet can sustain taking into consideration availability of food sources, water, and all the other necessities to sustain life.
You can calculate it by figuring out how many calories the planet can produce from all sources, agricultural and natural, crops, fish and fowl.
The following exercise is for illustration and not meant to suggest that the planet has lots of room still on it for human beings. We have chosen rice to do our calculations. Why that crop? Because it is grown by half the world’s population and accounts today for 20% of the total human caloric intake.
So let’s begin by starting with the number of calories an average human needs for daily survival.
2,000 calories
We multiply that by 365 days per year and the total comes to:
730,000 calories
Now we determine the total amount of fertile land that can be planted in rice. For this exercise we are going to use the total inventory of arable land on the planet. That number is:
38,488,090 square kilometers
Rice produces 1,250 calories per square meter. There are 1,000,000 square meters in a kilometer. So the rice calorie yield rate per square kilometer amounts to:
1,250,000,000 calories
Multiply that by the number of square kilometers and you get the optimal number of calories that we can produce annually growing rice. And the number is:
48,110,112,500,000,000 calories
Now divide this last number by 730,000, the number of calories one human needs to survive over a year, and voila, you have the theoretical carrying capacity of the planet.
Are you sitting down? Based on our calculation the number of humans this planet would support eating rice daily each year amounts to:
65,904,263,698
That’s almost 66 billion of us. Currently there are 7 billion humans on the planet so theoretically we still have a way to go before we max out on population, that is, if all we want to do is eat rice. Of course there are lots of factors that reduce this potential carrying capacity number. These include:
And war, disease, pestilence and plague.
For humans in the 21st century it is clear that we cannot continue to have one part of the planet consuming at an unsustainable level while other human populations subsist on very little but it is also true that there remains some wiggle room to give us time to fix the problem. All it takes is global leadership focused on sustainability. But if the recent Rio+20 conference is an example of what our leaders are capable of doing then we need to find others to provide us with guidance to achieve our common planetary goal. National self-interest cannot continue to impede all of humanity. We are a global society and we need to make global decisions about managing our ecological footprint. That way we can find a sustainable medium for all in the remainder of the 21st century and beyond.
]]>