Scientists have noted in several peer-reviewed studies that the Jet Stream in the northern hemisphere is not acting in a normal way. That’s why the last few years have witnessed sudden polar vortices that descend over parts of North America, Europe, and Central Asia, bringing abnormally cold weather for longer than normal periods of time.
It is a meandering Jet Stream that is seen as the cause. And now it is bringing Sahara Desert dust to the North Pole by pulling dust from North African cyclonic events and transporting the stuff in large amounts to the extreme north. The researchers note an increasing frequency in the phenomenon over the last few decades believing that change brought about by rising global temperatures is the primary cause.
The dust forms an aerosol that serves to dampen the normal radiative effect of Arctic ice. The Arctic is seeing more clouds as a result, which rain down grit in the form of carbon and mineral dust which is then deposited on the sea and land ice contributing to accelerated melt. The study states that “coarse size aerosol particles such as dust act like greenhouse gases by absorbing and emitting longwave radiation…..The longwave radiation plays a particularly important role in the energy balance in the Arctic because of prolonged polar nights with little or no sunlight.” The end result, radiative heating of ice surfaces with near-surface temperatures increasing.
The average lifetime of an aerosol particle from the Sahara can vary from days to weeks. Maximum concentrations occur during a period known as the Arctic haze season (late winter and early spring). The aerosols then accumulate as they rain out or fall to the surface where their physical, chemical and thermodynamic properties destabilize the ice surfaces.
The research shows that 60% of the Arctic dust appearing in the spring comes from the Sahara with a lesser contribution from the Taklamakan, Gobi, and other deserts. The mineral and carbon dust contributes to 24% of the absorption mass in the spring and summer contributing to thermodynamic changes in the ice.
This appears to be the first comprehensive study linking Saharan mineral and carbon dust to the Arctic albedo effect responsible for the shrinking of inland glaciers, ice shelves, and sea ice.
The authors of the study used observations from instrumentation on board the Meteosat geostationary satellite to compile the data, as well as data from the European Centre for Medium-range Weather Forecasts. From these sources, they were able to create a computer model that validated the distribution of Saharan dust from North Africa to the Arctic.
Our increasing understanding of the role the Jet Stream plays is significant as data we collect show an increased meandering “in a waveform pattern that allows the extensions of low pressure lobes and cold fronts much further to the south. …. These low pressure lobes can become stationary for a few days and block the normal circulation of the atmosphere.” It is this phenomenon that generates the dust storms in the Sahara and facilitates the transfer of aerosols to the far north.
We now know that here on Earth atmospheric dust can travel a very long way from its source. The phenomenon is not unique to our planet. In the past year, Mars has seen what started as a local dust storm grow into a global one that is only now, many months later, beginning to subside. The rover, Opportunity, may have been a victim of the aerosol storm that blanketed Mars. And recently images and data from the Cassini spacecraft show that a similar phenomenon is native to the Saturnian moon Titan.
While less dramatic than Mars or Titan here on Earth, and less obviously visible, we are witnessing a similar phenomenon on our planet and the movement of the dust poleward and westward is impacting the thermodynamics and albedo of the ice of Greenland, the Canadian Arctic archipelago, and the Arctic Ocean.

]]>
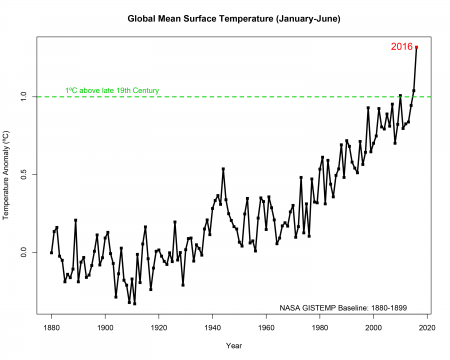
For the Arctic the global mean rise is nothing compared to the kinds of temperatures being witnessed above the Arctic Circle. Walt Meier, a NASA Goddard sea ice scientist states, “It has been a record year so far for global temperatures, but the record high temperatures in the Arctic over the past six months have been even more extreme.” Meier is part of Operation IceBridge, a NASA mission to map the melt appearing on sea ice where ponds form in the early summer and act as an excellent predictor of the extent of the total sea ice mass minimum will be by September.
In Alaska visitors to the Mendenhall Glacier, near the state’s capital city, Juneau, bear witness to just how much rising Arctic temperatures are impacting land ice. Back in 1979 my wife and I took an Alaska cruise from Vancouver and one of our stops was Juneau and a visit to the Mendenhall. When I looked at the pictures we took back then and the images available of the glacier today I was amazed at just how much had changed. But even more dramatic are views of the Mendenhall taken back in 1894 versus more contemporary images from 2008. You can see the change in the image below.
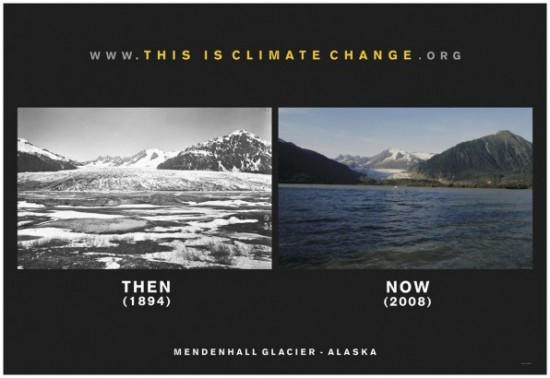
An ice dam in the lake that forms in front of the Mendenhall Glacier just a few days ago broke aided by the increasing volume of meltwater. Hiking paths to the retreating face of the glacier were inundated.
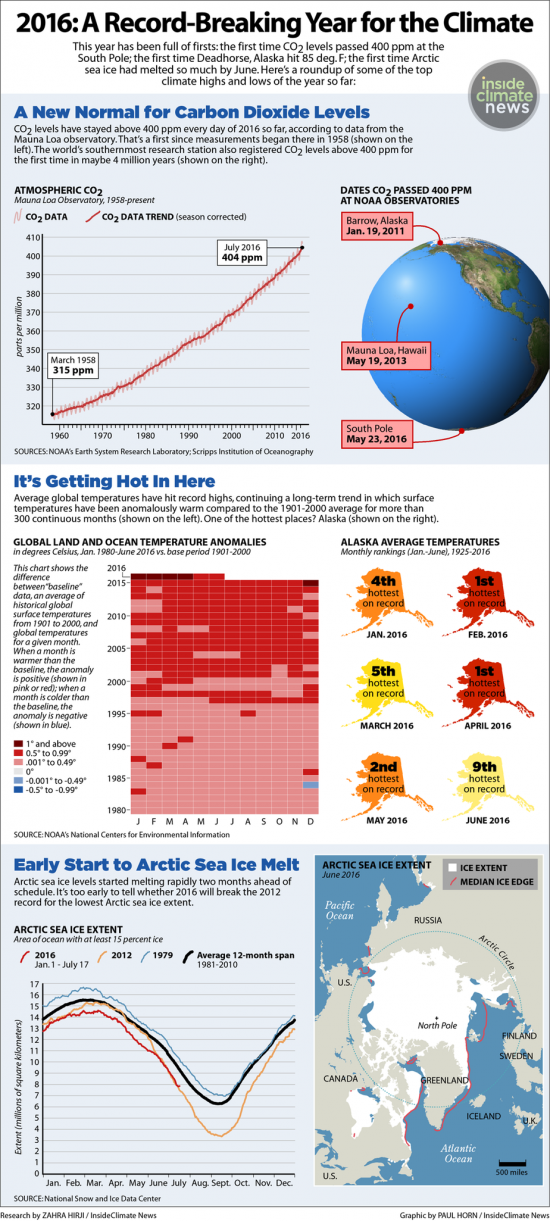
For Alaska, the U.S. Arctic outpost where NASA and NOAA scientists do much of their on ground and ice research, they note that these last six months are the warmest since records began in 1925. Deadhorse, Alaska, located close to the shore of Prudhoe Bay, on the North Slope Arctic coast, reached 29.5 Celsius (85 Fahrenheit) degrees on July 7. I share with you an infographic that provides some pretty compelling data about the extent of climate change being observed.
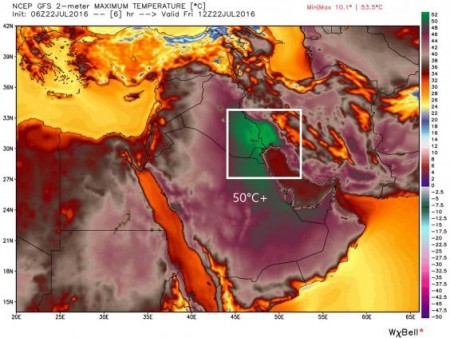
The poles aren’t the only areas of the planet feeling the heat. In the last week a weather station in Kuwait recorded a daytime temperature of 54 Celsius (129.3 Fahrenheit). Iraq, Kuwait and Saudi Arabia all saw temperatures exceeding 50 Celsius (122 Fahrenheit). The areas highlighted in green on the amp below are those experiencing what would be considered unlivable outside conditions for most humans.
What does this trend to ever increasing warmth mean for the human condition? Researchers estimate that rising temperatures could cost the global economy over $2 trillion US annually by 2030. United Nations research indicates that 43 countries are most at risk to seeing a decline in their gross domestic product (GDP) from 1 – 6% annually. Heat stress will impact China, Indonesia and much of the remainder of South Asia making it too hot to work.
In an episode of Amazing Race Canada aired two weeks ago, teams were asked to perform tasks in daytime heat combined with humidity that produced a humidex close to 50 Celsius. It was painful to watch contestants suffering in the extreme hot weather. The Canadian contestants were brief visitors to the area but for those living there the ability to work has dropped in terms of working capacity by 15 – 20% in recent years. According to a study by Asia-Pacific Journal of Public Health released in the last few weeks it predicts that work capacity will decrease even further by more than double in the year 2050. States Tord Kjellstrom, of the Health and Environment International Trust, Nelson, New Zealand, “with heat stress, you cannot keep up the same intensity of work, and we’ll see reduced speed of work and more in labor-intensive industries.” Will the impact be equally felt across the globe? According to Kjellstrom, no because “rich countries have the financial resources to adapt to climate change.”
A final note about the impact climate change is having in some of the more remote parts of our planet. The example is the Pamir Mountains of Central Asia, straddling Afghanistan, China and Kyrgyzstan. There climate change is altering the annual time cycles that human communities have relied on for centuries to understand when to plant, when to move herds, and when to harvest. Karfim-Aly Kassam, of Cornell University has headed up a team of researchers working with local residents to recalibrate time. They call the project the Ecological Calendar and Climate Adaptation tool or ECCAP. The hope is the results will help communities to better plan and adapt to climate change.
What has been happening in the Pamir? The inhabitants have seen a rise in glacial melt, more rain than snow, greater precipitation intensity and periodicity, disruptive river flow changes, landslides, lake bursts, flooding and rising temperatures. States Anthony Aveni, anthropologist and astronomer, from Colgate University, for these people “time is the environment.” Adapting to a disruptively altered climate calendar, therefore, is a matter of life and death.
Traditionally the Pamir communities have relied on 17 different local calendars for making decisions. These calendars don’t follow a January to December timeline. Instead days get counted from early spring and are plotted on a human body, a local leader known as a hisobdon who tracks the daily changes from toe to the heart and back again marking the seasonal cycles and normal annual milestones. Today hisobdon are in turmoil because planting is becoming a hit and miss proposition varying as much as by 15 to 30 days from just two decades ago. Wheat can now be sown at higher elevations on land never before used for agricultural purposes. Using these marginal lands means communities face an unknown whether they will succeed or fail from one planting to another. The ECCAP project, it is hoped, will add science to traditional Pamir practices and local knowledge. States Kassam, using the science of climate change means people will “be able to match their traditional practices in agriculture and grazing to a rapidly changing climate and thrive in the places that they have lived for generations.”
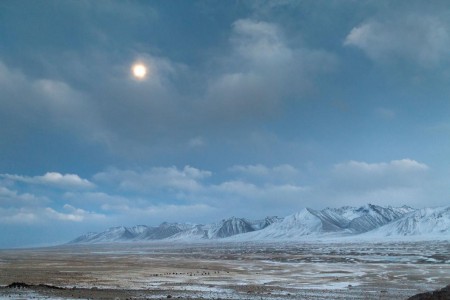
He goes to describe a prevailing theory that explains last winter’s polar vortex (see below a sample of last winter in the weather map from mid-January 2014) that hung over much of eastern North America. That theory is known as Arctic amplification. It hypothesizes that Arctic warming being greater than lower latitudes is altering the flow of the jet stream resulting in cold extremes being pushed south.

But the data in the study points to something very different. Overall it appears that cold pulses are actually on the decrease in the mid-latitudes of Northern Hemisphere and that Arctic amplification is actually reducing seasonal temperature variance. That’s because atmospheric circulation patterns point out that northerly winds and associated cold days are getting warmer far more rapidly than southerly winds and warm days. In the article Screen’s actual words state, “cold days tend to occur when the wind is blowing from the north, bringing Arctic air south into the mid-latitudes. Because the Arctic air is warming so rapidly these cold days are now less cold than they were in the past.”
The mathematical models Screen has developed indicate a trend that should continue into the future predicting declining temperature variability in cold months but not in the summer. One caveat to all of this. The Arctic represents a very complex Earth climate system and no mathematical model to date fully reflects all the linkages and variables related to sea ice loss, reduced snow coverage, permafrost melt and methane emissions as well as atmospheric circulation. So much more work needs to be done before we can be absolutely certain that Screen’s predictions will actually be right on.
But for those of us who endured one of Eastern North America’s coldest winters of late, Toronto’s second coldest in 25 years, we may take hope that future winters won’t approach the severity of this last one.


